The ASX200 (XJO) had a clear and significant breakout on 3rd February this year when it rose and closed above the high of 5679 that occurred on 21st August last year. The ASX200 closed last week at 5881, some 202 points above that high.
ASX200 Chart
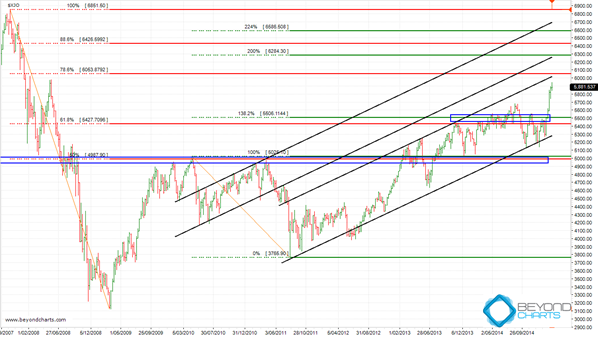
The weekly chart below shows solid black trend lines at the same gradient as those that I used in an article in the Switzer Super Report on 13th October last year. It also provides perspective on where the AS200 has come from since the beginning of the 2008 bear market and where it may go to from here.
Since that article on 13th October last year, the ASX200 has respected the lowest black trend line on three occasions, the first two of which formed a technical pattern called a ‘double bottom’ or a ‘W’ in December 2014.
A first ‘double bottom’ had actually formed in December of 2013 after which the ASX200 had tried, but failed, in breaking through the resistance zone at 5450 to 5550, shown by the upper blue horizontal rectangle.
Once the second ‘W’ had formed, the overhead resistance zone at that time, between 5450 and 5550, which had held strong on around six occasions, was in danger of failing in its resistance. This is exactly what happened on 3rd February with the clear and significant breakout.
Source: Beyond Charts
With the breakout behind us the probabilities of rising higher have got a whole lot higher, however there are never any guarantees with the markets. To maintain a high probability of rising higher the ASX200 MUST remain above the high from which it broke out, i.e. 5679, and definitely above its previous resistance zone of 5450 to 5550, which has now become a support zone. If price falls back into the previous range below 5679 in the first instance and then below 5550, then the probabilities of a continuing rise in the near future get a whole lot lower.
If the ASX200 remains above these levels then expect some resistance at the 2nd trend line (from the bottom) and the 78.6% Fibonacci level of the 2008 bear market, which is the 3rd red horizontal line from the top, i.e. between 6000 and 6050.
After some resistance at this level and continuing with the bullish scenario, I would expect the ASX200 to jump into the upper rising channel which is the channel formed by the two uppermost rising black trend lines. This channel may be the one that takes the ASX200 onto its first assault on a new all-time high and the high achieved back in November 2007 of 6851. Of course this is some time off and it won’t go there in a straight line, but this clear and significant breakout is the first step that needed to be taken to start that all important journey back to the top for the ASX200.
Gary Stone is the Founder and Managing Director of Share Wealth Systems.


I was hoping you will publish this chart and give us a writeup!
Great User Group Meeting last night, thank you for Share Wealth Systems, the ongoing education and community!
Significant resistance around 6050