The ASX200 (XJO) has had a torrid time over the last seven weeks falling 491 points, or 8.65%, from a high of 5679 to Friday’s close of 5188.
The question on everybody’s mind is whether the stock market decline will continue from here or whether this is it?
In short, the charts are telling us that we should expect further falls but to what extent and for how much longer nobody can know with certainty.
ASX200 Chart
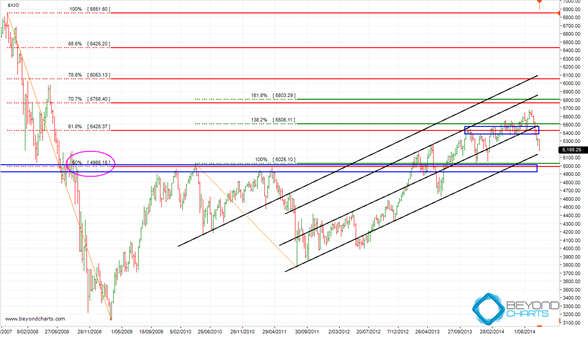
The weekly chart below can give us some insight into how far the decline may go and hence where we might expect some support to be found. By support I mean where buying of stocks will start gaining control over selling.
The left side of the charts shows the 2008 bear market decline. The importance of this from a technical analysis stance is that it puts all the price movement in the ASX200 since then into context until price moves either above or below the high or the low, respectively, of that 2008 decline.
An important level in the context of the 2008 bear market is the 50% retracement level, which is highlighted on the chart by the magenta ellipse. This level, which is 4986, has since formed an important resistance and support zone. Note how many times the horizontal blue rectangle through the centre of the chart was a resistance level from which price fell once it reached this zone or slightly rose above it before falling. I count seven occasions between September 2009 and April 2013. Since the breakout above the 50% retracement resistance zone it has been a support zone on three occasions.
This support zone roughly straddles a 100 point range between 4950 and 5050. In my technical view this is the last bastion of support that must hold to arrest this decline if it gets that far.
Source: Beyond Charts
There is a possibility that the decline might hold at the lowest upward slanting black trend line which is around 5138.
If these support levels do not hold then the next support levels below those discussed are 4830 and 4630. Whilst at this stage falling that low is unlikely, anything can happen in financial markets.
If these support levels mentioned above do hold then it is highly likely that the ASX200 will see a sharp rise, at least as sharp as the fall that has occurred over the last few weeks. Similar sharp rises occurred in July & December 2013 and in February 2014 all directly after sharp falls. That typically is how equities prices behave, they often tend to rise and fall at an inverted gradient to the one that preceded the fall or rise.
If a sharp rise does ensue from these levels as buyers regain control over sellers believing bargains are to be had, expect resistance in the first instance at the upper horizontal blue rectangle shown on the chart which is another 100 point range between 5375 – 5475.
If an up-trend develops from there to coincide with the expected Christmas rally then expect resistance at each of the up-trending black trend lines and at the horizontal red and green lines, all of which technically align pretty well.
Gary Stone is the Founder and Managing Director of Share Wealth Systems.


Hear hear Gary, your system’s timing was great and we are now awaiting signal to re-enter. Cheers