The art of trading is not about winning as much as it is about not losing. Like a business needs to control its costs, a trader needs to be able to minimise and withstand losses so that they are ready and able to take advantage of profitable opportunities. This comes down to managing risk at a trade and portfolio level.
Today I’m going to discuss a trading rule that has been regurgitated in book after book for many years. Pick up a book on trading the markets and you’re likely to read this rule as gospel. I’m talking about the ‘2% rule.’
If you’re someone that has never heard of the 2% rule, here’s a definition that I found online:
“The 2% Rule represents the actual percentage of a trader’s capital that he or she is willing to risk on a single trade should it go against them. So a trader with $100,000 capital will risk $2,000 per trade”.
Well today I’m going to dispel the perceived truth of the 2% trading rule.
Don’t get me wrong, using the 2% rule is better than using nothing at all but in my opinion, 2% is taking too much risk on individual trades.
How did I come to this conclusion?
Over the past 2 years, my team and I have spent thousands of hours testing and simulating risk management concepts to discover methods of preserving trading capital. We were looking to discover how the risk per trade equated to growth and drawdown in a portfolio. You might call it the position sizing ‘sweet spot’, where the risk per trade delivered the best reward, with the least amount of pain (drawdown) for effort.
We knew that if we could get this right that our customers would be able to understand how portfolio performance related to the risk they took on each trade. Customers would be able to consider their own personal and financial objectives upfront and then based on the simulation research, they’d be able to select the appropriate position sizing that best suited their financial goals.
The research process involved running over 1,000,000 individual portfolios with the help of our mechanical system, SPA3. To test such concepts, mechanical entry and exit signals for every trade were needed so we could objectively measure the risk per trade versus portfolio growth versus drawdown.
We ran multiple simulations using position sizes based on % risks per trade of 0.2%, 0.3%, 0.4%, 0.5%, 0.6%, 0.8%, 1%, 1.5%, 2% and 3%. We also researched different portfolio sizes, different brokerage rates and different system parameters
Here’s what we found…
What I am going to discuss here is some hard-nosed research using different % risks per trade. I should also explain that in each research simulation run we simulated 1000 portfolios, with each portfolio being defined as a unique and separate portfolio equity curve. Each portfolio equity curve was unique because the individual trades that comprised each portfolio were selected randomly through the life of the portfolio from a list of mechanically signalled trades on any given trading day when there was available capital in any portfolio to be filled with a trade(s).
Please stick with me here because I need to get technical to help you understand the research findings.
Box-plots
The box in the image below is called a ‘box-plot’. Each box-plot shows 900 of 1000 simulated portfolios for each % risk per trade. The box-plot represents the 5, 25, 50, 75 and 95 percentile portfolios so you can understand the range of performance from the best performing to the worst performing portfolios.
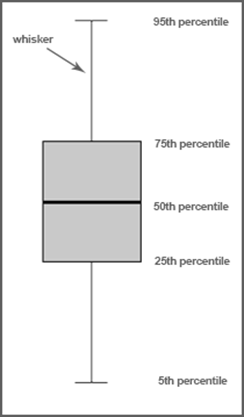
*When considering a statistical sample it’s common practice to omit the top 5% and bottom 5% from the results.
The Daily Geometric Mean
The graph below is called the ‘Daily Geometric Mean’. The Daily Geometric Mean indicates the growth of the simulated portfolios for each % risk per trade versus the average portfolio growth per day. E.g., a $100,000 portfolio with 0.5% risk ranged between 1.0008% and 1.0006% compounded growth per day.
So what are you looking for?
You’re looking for the narrowest possible box-plot from the top to the bottom of the whisker as it demonstrates that low variation between the best and worst performing portfolios were achieved.
You’re also looking for the highest growth or best performing portfolios which are indicated by the top of the whisker.
The ASX
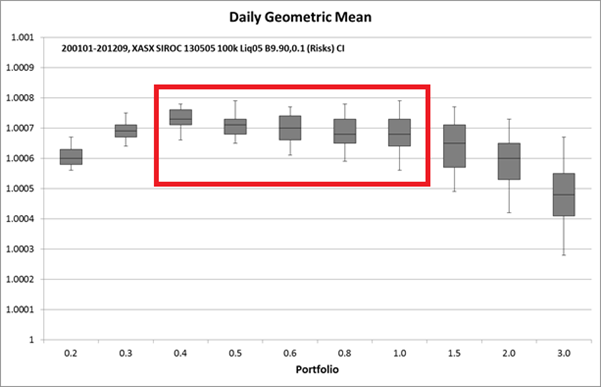
Using portfolio growth as the key decision criterion for trading on the ASX, the ideal position sizes for this trading plan scenario range from 0.4% risk per trade to a maximum of 1% risk per trade.
Note that 2% risk per trade and definitely 3% risk per trade (two box-plots on the far right) are far too big a position size with which to trade as growth has fallen away substantially.
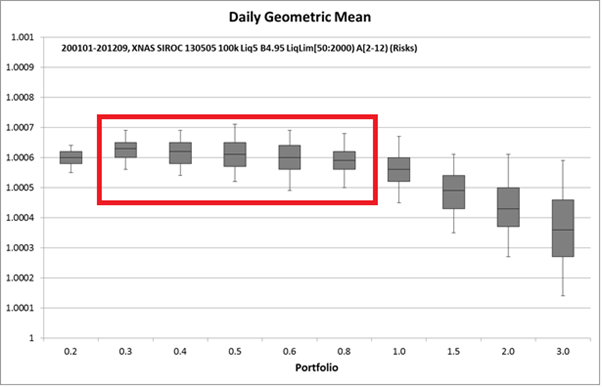
The same can be said for the NASDAQ
Let’s see if we found a similar pattern regarding position sizing on the NASDAQ. Again, from a growth perspective it would be unwise to use a % risk per trade money management regime greater than 1%!! In fact, 0.8% would probably be the limit if the NASDAQ does in the next 12 years what it did over the 12+ years in our research period. (PS, it could do better!)
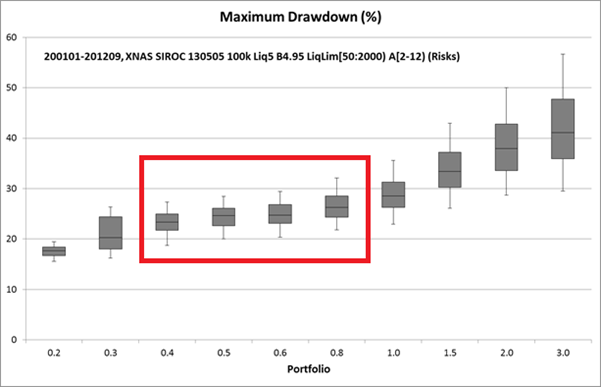
Maximum Drawdown
The second graph is the ‘Maximum Drawdown (%)’. The Maximum Drawdown shows the maximum drawdown that occurred for each % risk per trade. We used the same portfolios as above in the Daily Geometric Mean so you can understand how the risk per trade affects the potential for portfolio growth and drawdown.
Drawdown, as shown in the next graph below, gets far deeper when using the 2% and 3% rule. You can clearly see this by the two box-plots on the far right in the graph above. 1% risk per trade would probably be the largest position size to use from a maximum drawdown perspective on the ASX.
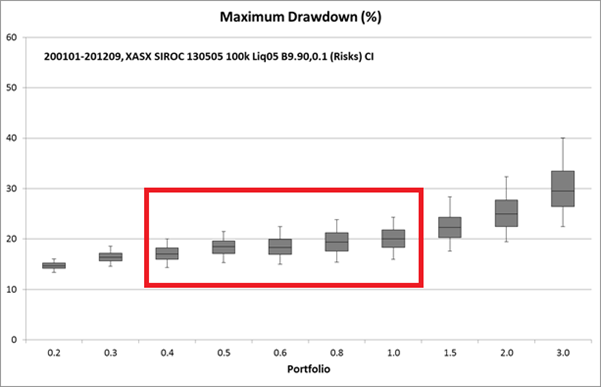
And from a maximum drawdown perspective on the NASDAQ, the limit might also be 0.8% risk per trade. 2% risk per trade would be far too big a position size to use.
Now remember that the NASDAQ had some huge drawdowns during the 12 year period from 2000 with the biggest being -76% from 2000 – 2002 so maximum drawdowns in NASDAQ portfolios should be expected to be a bit deeper than with ASX portfolios over this period.
The idea of this research is not to determine whether the mechanical system is profitable or not, as we already know that, it is to determine what the upper and lower position size and risk boundaries are for different customer trading scenarios, mainly to do with portfolio starting capital.
I trust that you now have the evidence to seriously question anybody that casually writes in a book or blog that you should use the 2% rule for your active investing.
In my view the 2% rule was never really researched and as it seemed to make sense, most other authors just regurgitated it in their books. I am suitably convinced that managing an active portfolio using the 2% rule is taking too much risk on individual trades.
There are other limiting factors when trading with too large a position size like potentially being forced to have too little diversification in a portfolio due to having too few simultaneously open positions and not letting enough trades sift through your portfolio to capture the juicy ones.
As important as it is to have a system with an edge, position sizing has the largest influence on a portfolio’s performance. And funnily enough it’s probably the most undervalued and under-prepared component of any investment strategy.
In conclusion, my view is the 2% rule is a myth and that far smaller position sizes should be used, at least half the size, on average, compared to the 2% rule!


The 2% Rule was probably simply based on the number of times one could lose 2% of a (steadily diminishing) sum before going broke compared with a much larger loss per trade of, say 5% o 10%. There was probably no research such as you have done. Congratulations on exposing a myth. It may take some time to bury it
What would you recommend for a trading system that pyramids-in at 25% a time? If one was using, say, a 0.8% Rule would one pyramid in at using a 0.2% max portfolio loss for each of the four purchases?
Thanks,
John.
Bravo Gary. This secret of ‘growing one’s account’ is not taught to the average member of the public.
I’m hearing you.
– and after a month of your SPA system I am totally impressed with its money management algorithms.
Buy/Sell signals are also more than adequate to work with. Now I can even look forward to the next down cycle/ recovery phase as an opportunity, since I will exit the market in good time and just wait for SPA entry signals. Cheers
Gary, if I’ve interpreted your graphs accurately, a 0.5% position size would be even more profitable than a 1% size? I suspect, though, that smaller position size leads to more frequent trading, leads to more brokerage which might be statistically significant?
Response to comment by John:
We haven’t researched in detail with portfolio simulations what I’m about to state so I’m talking from experience and anecdotal research in small samples.
The first partial entry should probably be half, or 0.4% of the 0.8% risk per trade, and then other pyramids should be added in diminishing amounts. This is the typical pyramiding approach.
An atypical approach is a ‘reverse pyramiding’ approach where a third or a quarter is committed at the first signal and then a larger portion, say half of the total position size, is committed on a pyramid signal provided that the pyramid signal doesn’t occur too late in the trend. This can be a riskier pyramding approach but waits for the trend to prove itself and those trends that fail the loss is far smaller.
With SPA3 pyramid signals are not displayed when a pyramid signal occurs more a third of the way to a Profit Stop target.
Regards
Gary
Response to Comment by Dave I:
Firstly, brokerage is taken into account in these simulations.
Yes, the less risk per trade the greater the number of simultaneuosly open positions which means more effort. For example, using 0.5% risk per trade you could expect to do nearly double the number of trades to a 1% rpt.
If brokerage per trade was larger than what we used to produce the box-plots above then it would make a big difference. In fact, brokerage was one of the biggest factors that affected returns and drawdowns, especially for small portfolios down at the $20K – $25K levels.
Also, this was for a $100K portfolio. What % risk per trade to use is affected by portfolio size.
Regards
Gary
Very interesting research. Another related rule is the 6% rule. Ie. you cannot have a total risk in your positions at any one time greater than 6%.
I don’t suppose you have any comments on that?
I personally have found more comfort with the 1% level myself (3 losses in a row, quite possible, is annoying but not a disaster. With 2% it is a total 6% loss which is more serious) Van Tharp in one of his books does say that professional money managers consider 2% too high and feel more comfortable with 1%…
Having a 0.5% to 1% risk per trade, is this what the initial stop loss is set at? Then do you keep the trailing stop loss at this level too?
Is there a profit sell % we should also set?
Hi Gary: Thanks again for sharing your research and knowledge. One question: What is the position size of the trades you researched? The %risk you write about is how much you are risking per trade. But you don’t mention how large the positions were eg. did you put 8% of your total capital into each trade (or did I miss it). For example, you could (hypothetically)put 50% of your total capital in one stock and still only risk 0.5% of your capital. Obviously if you did this you wouldn’t be diversified but you would be limiting risk.
Response to Comment by John C:
In essence the 0.5% to 1% is an ‘initial stop loss’ but this is not used to exit trades, it is used purely to calculate how much to place in a trade.
The problem every trader faces that uses a risk per trade position sizing approach is where to place the stop loss as this is required to calcuate the quantity of shares to purchase. The problem is that every price action is different as stocks have different characteristics at any given time.
So rather than use a particular TA technique or indicator to determine this we turned the process around and let the research tell us where to place it. We let quantitative analysis of 10’s of 1000’s of trades across the ASX and NASDAQ, rather than technical analysis on each individual trade, tell us where the initial stop loss should be. Volatility is the main trait we have used to determine where the initial stop loss should be for a given timing system for a given stock at any given time.
We then use that ‘initial stop loss’, or ‘trade risk’ as we call it, to calculate the position size for a given risk per trade.
We don’t keep that as a trailing stop loss as the trade develops because we use a predetermined technical timing exit mechanism.
How do we know it works? Because it has an edge (positive mathematical expectation, incl brokerage & slippage) researched across 135,000+ trades and across 1,000,000+ simulated equity curves on the ASX and NASDAQ. We also know that even the worst 5% – 10% percentile of randomly simulated portfolios outperform the ASX and NASDAQ indices by large margins, let alone the median or upper percentile equity portfolio curves.
Yes, a Profit Stop is used. Again, where to place this Profit Stop has been devised using quantitative analysis rather than technical anlsysis and the Profit Stop calculation is different depending on the characteristics of the stock at the time of trading it.
Regards
Gary
Hi Gary,
Thanks for publishing this research. It backs up what I have discovered from experience for quite some time. In my SMSF I have been using 0.5% for years and recently worked out that even that was too large. At a recent meeting of a trading club I run in Brisbane I spoke on the subject and told members that they should reconsider their position sizing ideas.
While your results seem to concentrate on portfolio growth and drawdown (very important considerations) my contention was that using the 2% rule or even 1% usually resulted in too few trades to ensure your results came close to mirroring the results obtained from testing a particular strategy.
As an extreme example I used a trade where the initial stop happened to be relatively close to the opening price and using the 2% rule would have meant that 75% of the portfolio would be devoted to this one trade leaving nothing much for other trades the strategy would recommend.
You do mention this in your article but in my opinion this fact alone is enough to make the 2% rule suspect.
Cheers,
Will.
Response to Comment by ‘fastbucks’:
The discussion on the ‘6% rule’ deserves a journal posting of its own. I’ll cover this next week.
Regards
Gary
Response to Comment by Peter:
The position size in dollars will be different for each trade, for a particular % risk per trade, but the risk taken against portfolio capital for each trade at the outset of the trade will be exactly same.
The exact $ position sizes taken for the trades in our public portfolios are published each evening for all our current customers to see via a secure download process.
To give you an idea, a smaller portfolio of around $70,000 not using any leverage and using 0.85% risk per trade, can have positions that range from around $2,500 all the way up to around $8,300 depending on the price action characteristics of the stock leading into the trade.
Importantly, the risk taken for each of those position will pose the same risk to the portfolio at the outset of the trade.
This is the idea, normalise risk to the overall portfolio per trade regardless of the stock being traded.
It would be impossible under the risk & money management rules in SPA3 for a single trade to be allocated a position size of 50% of portfolio value. Using CBA, which is a very low volatility stock, and using 1.5% risk per trade, which would not be recommended (see charts above), the position size calculated by SPA3 is around $14,100 or just over 20% of portfolio value.
Using 1% risk per trade that postion size comes down to $9,300 which is < 14% of portfolio value. Regards Gary
Response to Comment by Will:
Spot on! Position sizing approaches using ATR multiples run into similar problems with positions being too large for most trades.
What these approaches then do is use a maximum limit for a postion which typically is a % of portfolio capital, e.g. 5%, 6% or even 10% of portfolio value. My questions to this approach are: “What % limit do you impose, how do you know what effect it will have on protecting capital and what effect it will have on limiting portfolio growth and should it be the same % limit for every trade when every trade has different characteristics?”
What’s the use of using a position sizing calculation that needs to be vetoed by a % limit for most trades? Most positions will just end being the imposed % limit except for the ones that are a long way from the initial stop or are very volatile! And for these individual trades are you not taking more risk that the % limit imposed ones?
Of course there are issues on the other side of the spectrum if your % risk per trade is too small:
1. your system needs to signal sufficient trades to expose your capital to the market according to your risk profile, and
2. if it does, you can end up having to manage a lot of open positins which may be too many for you. If you then reduce the number of open positions but keep the % risk per trade the same you will probably be taking too little risk!
Regards
Gary
I don’t believe any type of ‘Fixed Fractional’ money management works, whether 0.8%, 1 or 2%. The method is fundamentally flawed.
The ‘Fixed Ratio’ method appears to have it over all forms of money management, even ‘Optimal f’. With ‘Fixed Ratio’, the formula is Current Balance + (# Contracts*Delta)=Next Increase in Contracts.
Delta is simply the ratio between contracts traded to $ required. Depending on how aggressive or conservative you want to be, you simply change the Delta in the formula accordingly. A smaller Delta is more aggressive while a larger delta is more conservative. Volatility and stops are ignored and the number of lots traded changes at varying levels.
If you doubt it, do some research online and you will see that it outstrips all other forms of money management.
Response by Comment by Shane:
Strong views! There are many things that traders use that don’t work well but to “not to work at all, full stop” is a big call. As with most things in life there are degrees of how well things work and it typically depends on the person’s scenario.
How well any money management algorithm works will be born out by the results it produces firstly in detailed and rigorous research and then in live trading. There is no doubt that the fixed fractional approach works, absolutely no doubt. Our recent research published in a detailed White Paper has conclusively demonstrated this.
Could some other concept work better? Of course. Firstly, what would better look like? That is, define ‘better’. Then, how much better and will it be better in all conditions and portfolio circumstances and risk profiles?
I agree with your sentiment about Optimal f. If pushed all the way to the optimum the problem with Optimal f is that it is so ‘optimal’ (usually too large) that with a minor change in conditions it can fall ‘off the edge’ and lead to disaster. However, if not pushed all the way to the optimum then Optimal f (may need to be renamed) can work quite well.
I am fully aware of the ‘Fixed Ratio’ approach by Ryan Jones. Read his book around 2001/2002 and have referred to it a number of times over the years.
Shane, perhaps you would care to explain:
1. why Fixed Fractional is flawed,
2. how one chooses the subjective ‘delta’ for one’s own portfolio scenario when using FR, and
3. how the Fixed Ratio model would work for a stock portfolio, where every stock has a different price and where position sizing is not ‘contract’ based.
Also, I seem to recall that Ryan Jones himself has stated that FR works better that FF for smaller futures trading accounts but that when the futures portfolio gets large, switching to FF would be better. I will look for this statement to try to back it up with a reference.
Regards
Gary
hi Gary
I’ll answer 2 + 3 first
2: “how one chooses the delta” – same way you determine anything in trading – backtesting past results with different deltas. I have the spreadsheet that came with the article and you basically enter a period of data, 5 years was mine, and then change to different deltas to see the results. And it was most interesting.
3. “How does the Fixed Ratio model work for a stock portfolio.” I can’t give an answer to that as I have traded a stock in over 4 years. I have no interest in the stock market, Gary, but make no judgement if that’s what works for you. My only instruments I trade are commodities via seasonal spreads, FX (mainly swing trading) and Options.
1. “Why is Fixed Fractional flawed?” My main reason for the statement is the stark results when the same data is tested using the Fixed Ratio method and the results then placed alongside each other. For me it is flawed as it does not make as much money as Fixed Ratio……when correctly applied. There are many examples with mathematical equations, but I am satisfied with what I have found.
All good, Gary. Everyone will find their own feet and what works for one may not work for another.
Nice chatting, Gary. I’ve not seen you for a few years now.
cheers
Shane
Reply to second Comment by Shane:
Understand that your situation is now futures markets which explains quite a bit about your preference for Fixed Ratio.
IMHO, Fixed Ratio lends itself far better to trading ‘contract markets’ than stock portfolios because in futures markets each contract size for each futures market is static.
However, with stocks, just saying that one contract = one lot (typically 100 shares but could be any number of shares per lot) simply doesn’t work when one has multiple open stock positions in a portfolio and each stock has a different ‘contract size’.
There is no doubt that Fixed Ratio can make portfolios grow quicker but it also takes more risk than Fixed Fractional and hence experiences deeper drawdowns especially on larger account values.
Look forward to catching up again at some stage to share experiences.
Regards
Gary