While my personal and company trading decisions are based 100% on the SPA3 mechanical trading strategy and its researched technical criteria, there are many other well respected forms of technical analysis that one can use to analyse trends in different time frames.
I wrote this piece for Peter Switzer’s ‘Switzer Super Report’ earlier this week with a longer term horizon. As many of you reading this know SPA3 is a medium term active investment strategy but Peter’s Super Report requires my technical view with a longer term outlook.
I hope you enjoy this educational piece.
Primary Health Care Limited, a $2.39 billion market capitalised business, is one of Australia’s leading listed healthcare companies operating across four main areas: medical centres, pathology, diagnostic imaging and healthcare technology. It listed in mid-1998 and performed brilliantly until the beginning of 2007 when it peaked at over $10 registering a ten-fold increase in its share price since inception.
The weekly chart below shows its fall from grace to August 2011 when it bottomed at $2.56. Then from August 2012 Primary Healthcare’s share price started to recover when it more than doubled to a peak of $5.43 in May 2013.
Descending Triangle
Since May 2013 to current a descending triangle has formed. This price formation is what initially caught my attention as the triangle is nearing its apex when I believe there will be a price resolution one way of the other where a breakout will occur to either the downside or the upside.
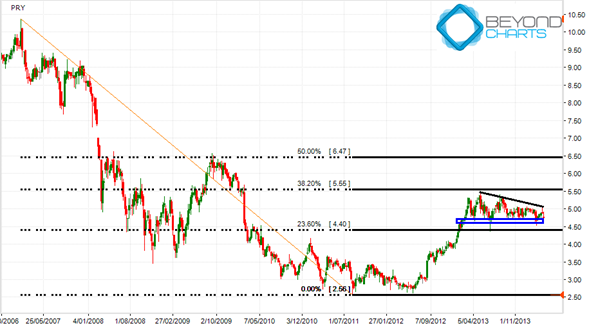
Typically a descending triangle is a bearish pattern which indicates a high probability of price weakness when price reaches the apex of the triangle. This is because lower highs occur forming the black descending trend line.
However in recent times I have witnessed many similar price formations breakout to the upside, making the pattern a bullish one, in hindsight. One explanation for the breakout not occurring to the upside could be that the pattern is not forming after a significant run-up or when price is not significantly overbought.
Technically, the way to play this formation is to wait for a price breakout, either way. If it is to the upside then take a position and set a stop loss below the blue support and resistance zone. Usually the stop will not be that too far away from the entry price limiting the risk taken to just a small one. The target is potentially the 50% Retracement zone around the $6.45 – $6.50 area.
How is PRY performing against its peers?
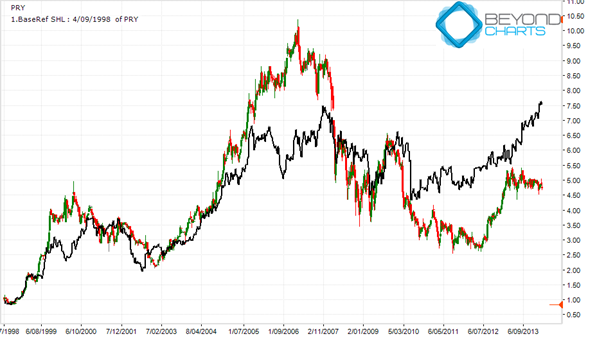
PRY’s closest peer on the Australian Stock Exchange is Sonic Healthcare (SHL). The weekly chart below is a base comparison chart displaying the price of both PRY and SHL, the black line, based at the same price as at 4 September 1998 which was soon after PRY listed.
The base comparison chart shows PRY’s outperformance of SHL until January 2007 then a period of matching each other until May 2010. Since then SHL’s price has outperformed PRY, especially since May 2013 when PRY’s descending triangle started its formation.
After a 38% increase in its dividend earlier in March, PRY has a trailing PE Ratio of 15.21, and Earnings Yield of 6.58 and Dividend Yield of 4.23 compared to SHL of 19.14, 5.16 and 3.63, respectively.
Other high profile stocks in the Health Sector are Ramsay Health Care (RHC) and CSL. The weekly chart below shows a base comparison of all four, also from 4 September 1998 with CSL the green line and RHC the blue line.
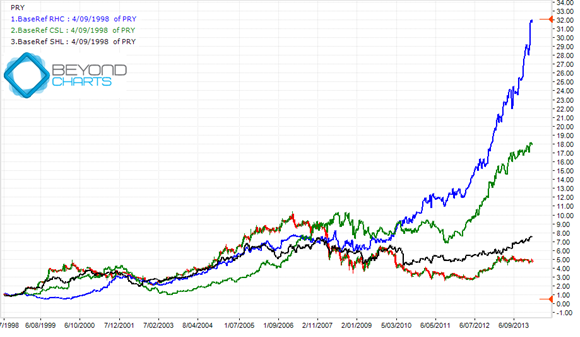
RHC has a trailing PE Ratio of 36.14, and Earnings Yield of 2.77 and a Dividend Yield of 1.55. There is no doubt that the Australian stock market has had some great growth stocks that have been chased by investors over the last two years or so and RHC and CSL have been two of them.
PRY has outperformed all three of these peers in the past and it may just be primed to do so again and cease its current role of playing second fiddle to its closest peer, SHL.
Keep an eye on the descending triangle pattern and a breakout to the upside for a good clue as to when to take a position. Of course, risk should always be managed so remember, if the breakout occurs, to place a stop loss just below the blue support and resistance zone.

