In 1990, when I first got bitten by ‘the market bug’ and started spending hours and hours stooped over price charts and listed company financial statements, using technical analysis and charting was often likened to reading tea leaves or using voodoo to make decisions in the financial markets. This was the opinion of the great majority of brokers and certainly nearly all private investors.
23+ years later I still often get asked about reading charts and why I waste my time ‘reading tea leaves’. Indeed, good friends, let alone strangers, typically met on a golf course, whom ask what I do still make light of the technical analysis world in which I have lived for over two decades now. I used to try to explain but have long since decided not to persevere unless genuine interest in shown. Even hosts of the Foxtel Channel 602 show on which I regularly appear, Your Money Your Call, sometimes make light of charting.
This is despite the acceptance that technical analysis has achieved over the last decade through the plethora of books that have been published on the subject, analysts being employed by the majority of Managed Funds, the inclusion of charts on broker platforms and websites, TV shows such as Your Money Your Call on which I appear regularly and the huge amount of online information available on the subject.
Technical analysis is based on observing price and volume action of stocks, indices, commodities or any financial instrument. In my view, and many others whom have also used technical analysis very successfully to profit from the market, price and volume action is the language of the market as the movement of price and volume over a period of time provides accurate insights into what market participants views are about the rolling near future of a stock, index or commodity.
Observing price action works because everything known and unknown, perceived or true, assumed or expected, intrinsic (such as fundamental financial performance) or external to the stock/commodity being analysed is built into the net movement of its price.
Understand the language of the market and you will be able read, listen and sense its movements well enough to devise an edge from which to generate profits in an appropriate timeframe (ultra-short, short, medium or long term) to meet your requirements.
In this week’s blog, as an example, I cover a price action pattern called a symmetrical triangle. This is typically a continuation pattern which means that the direction in which the price was moving prior to the symmetrical triangle forming is the direction in which the price will continue to move.
A symmetrical triangle is defined by the converging of two trend lines that border lower highs and higher lows and will typically see a narrowing of the range of the daily bars as the convergence point approaches. As the price gets more and more ‘cornered’ a breakout becomes more and more imminent. The full convergence doesn’t necessarily need to be achieved for the breakout to occur and the breakout doesn’t necessarily need to be in the direction of the continuation. Sometimes false breakouts occur to the downside before reversing and rising sharply in the direction of the continuation. Sometimes the breakout occurs to the upside followed by a test to the downside before rising sharply in the direction of the continuation.
These are examples of real money trades that I have executed in the market on the NASDAQ where a symmetrical triangle pattern has occurred.
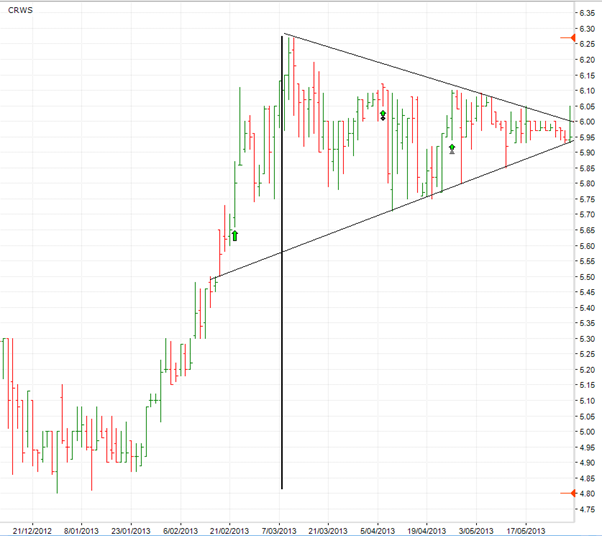
I didn’t know at the time that I entered this trade in CRWS, above, on 9 April at $5.83 with a MOC order that a symmetrical triangle would form, although the early signs were evident. But as it continued to take shape I knew that the probability increased of a breakout to the upside.
This formation is also called a ‘flag’ where the vertical line from the previous impulsive breakout (around $4.95) to the top of the ‘flag’ formation (around $6.25) is called the ‘flagpole’. The length of the ‘flagpole’ (6.25 – 4.95 = $1.30) provides an indication of where the breakout from the symmetrical triangle might find its first (and maybe last) serious resistance, or target, at $1.30 + $6.00 = $7.30.
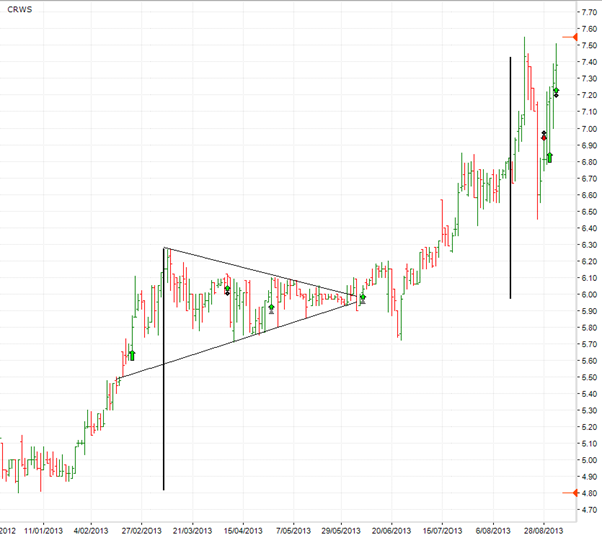
A high close of $7.43 occurred on 20 August and I exited on a SPA3 medium term exhaustion signal on 29 August at $7.14 for a 22.7% profit trade.
Getting a trained eye for the many price patterns that form in the market can take quite some effort to achieve. What confuses and causes many to give up or lose interest is that technical analysis, although based on scientific principles, is a mixture of science and craft, and hence is not a perfect science. Whilst this is understood most still expect it to be.
This being the case there are many occurrences where patterns don’t work out as expected. When this occurs the crafts person uses risk management techniques to limit the fall out while profiting handsomely when the patterns do work out. Those that don’t persevere never get to this stage, a bit like the carpenter whose craft is based on scientific principles but requires perseverance to become a great crafts person of wood.
What SPA3 does is negate the need for individuals to learn all the different technical analysis price and volume patterns. The SPA3 signals can be seen on the charts above and below. These can be followed as is without attaining a technician’s trained eye.
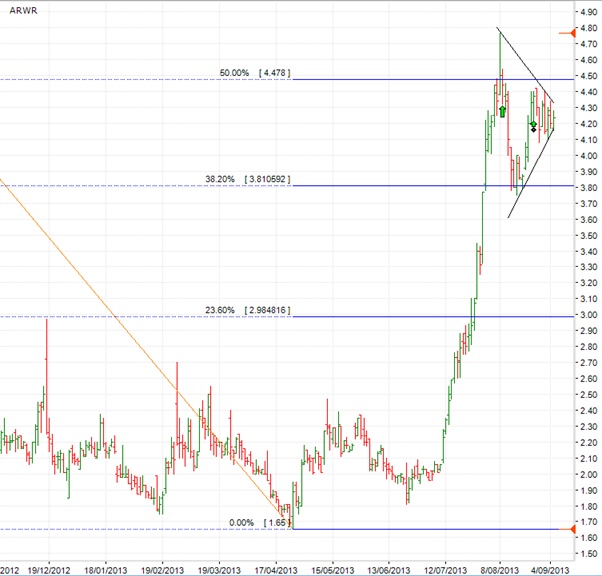
Here are another two NASDAQ listed trades to keep an ‘eye’ on, both of which are open SPA3 positions in our publicly traded real money SPA3 NASDAQ Portfolio. Watch for the breakout and how these may play out. What makes this craft so fascinating is that there are no certainties, just probabilities with each occurrence being unique despite looking so similar to a previous experience.
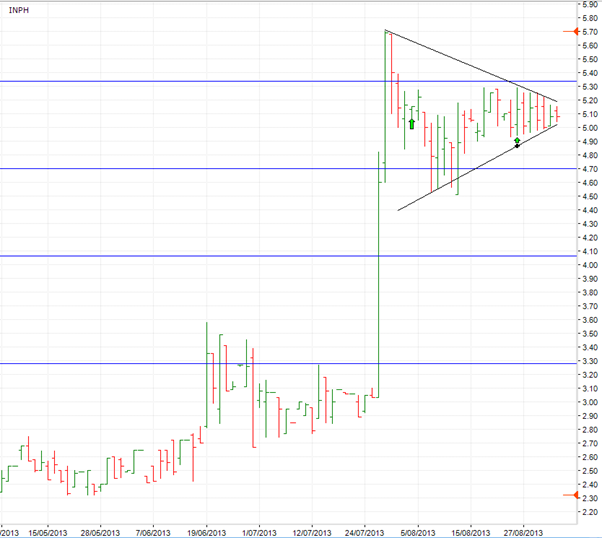
The projection from the INPH ”flagpole’ above could be huge at around $2.50, or a 48% projection from the convergence point. Similarly, with ARWS below the ‘flagpole’ is around $2.30, or 54% from the convergence point.
If they don’t work out we’ll get an exit signal to limit our loss and we’ll move onto the next SPA3 signal which invariably coincides with one or another technical analysis price pattern.


I worry about your 4th para on page 3.
I recently read how hopeless economists are at predicting share price movements because they assume perfect knowledge by share traders. In fact your SPA3 method is reactive to the mood of share traders and not to their perfect knowledge.
I have developed a new ASX indicator (the ALine) which says that a new bull market began on 28th June and has made an uninterrupted rise ever since.
Ian Aberdeen