Over the last month the S&P500 has had a sharp fall followed by a sharp rise, as have most other equity indices around the world.
Two weeks ago I suggested then that equity markets had a little further to fall and that there was a high probability that this would be followed by a short sharp rise of an equivalent but inverted gradient. This is precisely what has occurred. But where, in the short-term, could the USA equity markets lead the rest of the world equity exchanges from here?
S&P500 Chart
To answer this question I have chosen just a few of the many technical analysis techniques available to assist with the task.
The daily chart below stretches back just over a year to September 2013. The solid black horizontal line protruding from the bottom left corner shows the previous S&P500 all-time high achieved in 2007. While the S&P500 remains above this level it is in secular bull market territory.
The aim of technical analysis is to put some order around what may appear to be the random movement of stock market prices. Hence the lines and patterns on the chart below.
The red upward slanting trend lines define a channel in which the S&P500 has been moving for more than two years since May 2012. In early October the first signs appeared that the lower support line of the channel was no longer going to be respected.
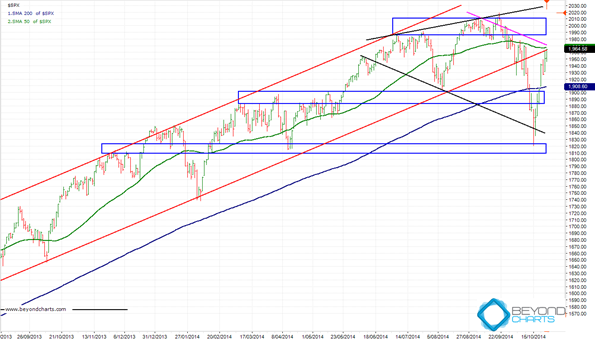
Source: Beyond Charts
The blue horizontal rectangles are support and resistance zones that have formed over the past year where prices have halted after short-term upward or downward moves.
The green line is a 50 day simple moving average (SMA) and the navy blue a 200 day simple moving average, or a 10 week and a 10 month SMA, respectively.
The two solid black diverging trends lines at the top right of the chart form a reverse symmetrical triangle, also called a broadening top. This pattern has a reputation for being a bearish pattern however, in my opinion the probabilities are too low for this formation to held in this view as it has roughly a 50/50 chance of breaking out of the pattern on the downside. What it does do though is provide another boundary to which price could gravitate before encountering resistance or support.
The last pattern is the downward trending channel bounded by a declining magenta trend line on the upper side and the declining black trend line on the lower side (also the lower line of the broadening top).
So what can we gleam from these patterns and short-term boundaries?
First up it should be stressed that a long-term up trend is still most definitely in place. Over the last year this recent dip has been almost exactly a 38.2% Fibonacci retracement of the 12 month rise. For some time I have been stating on Peter Switzer’s TV show that we should expect such a retracement as one hadn’t occurred since May 2012. Well now it has.
Next, the Friday 24th October close on the S&P500 has coincided with the 50 day SMA, the upper boundary of the downward channel (the declining magenta trend line) and the upward slanting lower trend line of the rising two year channel. Hence, expect some resistance at the current level.
If this up-swing has further strength the S&P500 could rise further to the next resistance zone overhead, the blue rectangle, or even to the upper rising trend line of the broadening top. Such a move would be a huge show of strength, being a near 100% upward retracement of the recent decline.
The odds are higher that resistance will be found before heading that high. Regardless of where resistance is reached, expect another fairly sharp retracement. And then expect support for that fall to be at either of the horizontal support zones shown on the chart or, in worse case, all the way down to the lower declining trend line of the broadening top which is also the lower trend line of the downward channel.
Ultimately, for this primary bull market to continue the S&P500 will have to breakout to the upside of the broadening top and the uppermost horizontal resistance zone. Alternatively, a fall below the lowermost blue rectangle support zone would see a serious fall in the S&P500.


How can we better capitalize on these dips over the last 2 month ( 300 pts down, 300 pts up) as my looks won’t make me any money. Thanks
Excellent technical analysis! Keep up the good work ! Gary
Response to Comment by Philip:
Tough one Philip but whichever approach one uses to invest in the market some sort of short-term analysis and risk management will be required to take advantage of such sharp V-bottom dips.
Meaning that even if one uses a long-term strategy, a short-term mindset and short-term analysis skills will be required to take advantage of these every-now-and-then opportunities.
This means that one would need to introduce short-term techniques to a medium-term and/or long term investing horizon but only under certain conditions which would need to be strictly defined otherwise an existing strategy could be hijacked to become a totally short-term strategy.
Easy in hindsight and in small samples but difficult to achieve on a consistent basis over many years.
Regards
Gary