For those building a system I can only commend you for taking on such a challenging and potentially rewarding task. It must be said that it is not for everyone as the skills and focus required for developing an edge are somewhat specialised and niche. The 4000 plus hours I invested into SPA3 has taught me this and I have a Maths and Computer Science background which made the task somewhat more achievable. Furthermore, this is what I do and hence have time, focus and resources around me to enable the completion and ongoing maintenance of an edge. I say this as the majority of people who make a decision to develop a system never actually complete it and hence never really get to trade it.
For those interested in buying an edge the equation below may seem less important. But you should have the knowledge to be able to assess any business in the financial services space that may provide advice to you (newsletter, broker, tipster, investment manager,systems provider etc) by asking the question “what is your edge”?
They should be able to prove to you that they have x amount of winners and y amount of losers and that the winning trades are z larger than the losing trades, over a large sample of trades, regardless of what analysis approach they use. At the very least, if a company cannot do this then you should seriously consider not investing money in their strategy or approach. There are other metrics that should be sought but we’ll leave that for another time.
Now that you have a better appreciation from past postings that an edge is needed, the next step is to understand exactly when an edge is good enough to trade profitably and also when there is no edge (i.e. a losing approach).
The first thing we need to know is at what point an edge becomes positive i.e. the minimum threshold.
This break-even point is a Mathematical Expectation (ME) of 0. Outcomes less than 0 lose money and greater than 0 make money.
Let’s use a coin toss example to illustrate what we mean by a break-even edge. If, for whatever reason, over a large sample of coin tosses, we only win 20% of the tosses we would need to win $4, on average, with our winning tosses if we lost $1, on average, for every losing toss, just to breakeven. Mathematically:
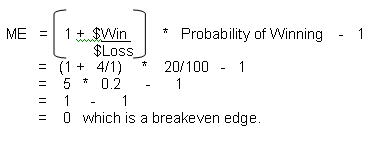
We call the 20% in the above example the Win Rate. We call the average dollar win divided by the average dollar loss the Profit Ratio, i.e. 4/1 = 4 is the Profit Ratio.
Using this formula, the Profit Ratio required to achieve a breakeven threshold for a given Winning Rate can be calculated as follows:
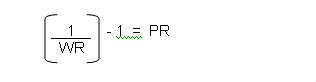
where WR = Winning Rate and PR = Profit Ratio.
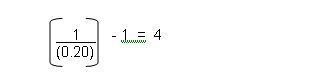
In the above example where the Win Rate is 20% the Profit Ratio to breakeven, as we now know, would need to be:
For example, if 34% of closed trades are winners, what Profit Ratio is required to reach breakeven?
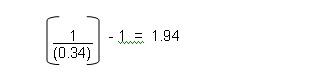
This means that the 34% of winning trades would, on average, need to be 1.94 x larger than the losing trades, after trading costs, to break even. A Profit Ratio greater than 1.94 would mean, over time, that your closed trades would be showing a net profit.
So depending how often a trading approach wins, the Profit Ratio defines how much bigger the net profit for winning trades, on average, must be than the net loss for losing trades, on average, so that you breakeven or better.
Any edge that is better than breakeven will make money over time provided that sensible money management is used. For example, if all capital is placed on single trades this could lead to disaster over a small sample of trades.
The Breakeven Table below shows, for a given Win Rate, how much a winning trade, on average, needs to return for an average loss of 1 unit.
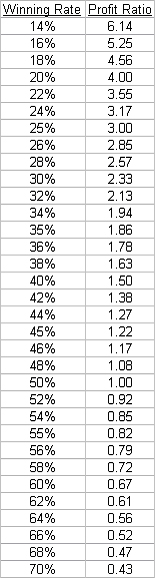
As you can see from this table it is possible to make money with an edge that has 84% losses provided the profits are on average more than 5.25 times the size of the losses. Just about all of us would, of course, find it extremely challenging to trade such an edge.
Those that prefer a diagram, the one below shows a solid black line that depicts a breakeven edge. Note that the final edge that you trade should include brokerage, commissions and slippage.
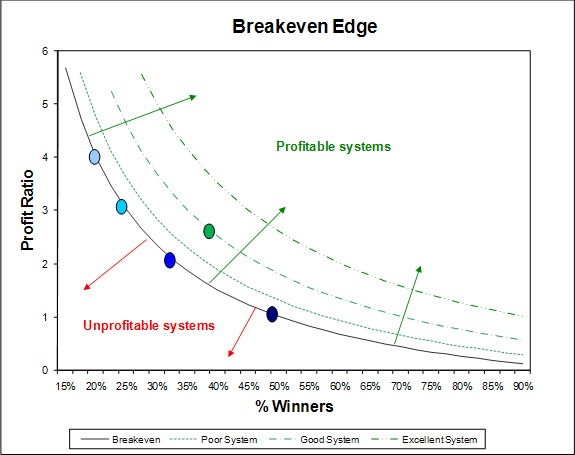
The leftmost dot (also the uppermost one) on the breakeven line is positioned at a winning rate of 20%. A profit ratio of four will be required to break even, net of brokerage and slippage. The rightmost dot on the breakeven line is positioned at 50% where a Profit Ratio of one will be required to break even, net of brokerage and slippage.
The green dot positioned on the “Good System” line is SPA3.
Any system with an edge that falls below the breakeven line has a negative mathematical expectation and hence virtually no probability of being profitable over a large sample of trades. Through luck, over a small sample of trades you may make money, but the more trades you complete with a negative mathematical expectation system, the higher the probability that you will lose money. Absolutely no type of money management rules can save such a system over a large sample of trades.
Any system positioned above the breakeven line can make money. The further away from that line, the higher the probability that not only will it make money but also that it will be profitable from a smaller sample of trades. Also, the further away from the breakeven line, the less volatile the system’s equity curve should be and the steeper the equity curve should be. This means lower drawdowns while making money faster.
A good system does not need to be that far away from the breakeven line to make good money as the power of compounding is on your side when you have a positive mathematical expectation working for you in the market. I use the word ‘can’ rather than ‘will’ because poor money management rules will undo an edge with a high positive mathematical expectation as will poor trading psychology.
In reality, generating a system that is at or further away than the ‘Excellent System’ line will be difficult to achieve. If you do, there may be a high probability that the system is either overly optimised and hence curve fitted to a narrow price action dataset, or has too many criteria and filters which means the same thing. It is overly optimized by constraining its degrees of freedom. This may also occur with a system that trades infrequently, i.e. the historical testing generated a small sample of trades. Again, this usually results from too many criteria and over optimising.
There are many other metrics that could be established to compare one edge to the next that we won’t go into here and now.
There are a few terms that are not defined above that we can leave for another day but in the meanwhile it is important to understand the need for an edge, what an edge is, where the breakeven line is and where your system is relative to it, over a large sample of researched or live-traded trades.


Thanks for the very interesting comments and charts. However, its important to note that the success of any system is based on which stocks are bought, at what time and at what price. Even with a “SPA” edge the purchase of recommended stocks will produce completely different results depending on which of the recommended stocks are purchased at what price. Foe example, ten different people will have ten different financial results.
Gary, I have often thought about how the position sizing values were arrived at for the Hedge in the SPA Hedging system. ie I am concerned that the values were simply optimised to get the best return over the 8 year period that the backtesting was performed over. How can the Hedge backtesting (n=30) be defended from the criticism above of “too few trades …and over-optimised”?
Gary, It appears the fundamentals of the edge is to cut your losses short and let your profits run which is easy said than done. Also I beleive in timing the market compared to time in the market as a crucial factor which is also difficult to do but can generate better rewards if done right. As can be seen with the present bear market we don’t know when it will turn except to say it appears to be bottoming out and trending sideways but what further direction it takes is anyone’s guess. At the moment I think we can only look at trends and volume of particular stocks and be cautous in the present environment.
Spot on discussion. Gary I be interested to know your opinion on the drawbacks of trading a system that rates as ‘excellent’ on the PF-Win% chart, and has there been any ‘de-tuning’ of the SPA system to rate is as ‘good’ visa-vi ‘excellent’ to ensure that is it robust enough to produce consistent results and to suits the trading / investing profile of the typical SPA retail investor? Do you believe there are difficulties in developing an ‘excellent’ mechanical system that is robust enough to actually trade (ie – one that is not overly curve fitted)? Or are there other drawbacks to trading a system that sits further away from the curve? eg – possibly drawdowns? (although my initial impression would be that DD’s wouldn’t be a function of which side of the plotted curves you’re on but risk allocation per trade.) My own system has a profit factor ~3.5 and a historical win rate of about 38%. Also a note to other readers that although you can have effectively identical systems in terms of returns with markedly different strike rates and profit ratios, trading a system with a low strike rate will provide an equity curve that is psychologically quite difficult to trade – lots of small losses followed by a big win. Conversely, trading a system with a very high strike rate will provide a consistent string of small winners followed by a large loss; most day trading systems fall into the latter category. Keep up the great posts Gary, especially these technical systems-related discussions.
Response to comment by Zig:
“ie I am concerned that the values were simply optimised to get the best return over the 8 year period that the backtesting was performed over. How can the Hedge backtesting (n=30) be defended from the criticism above of “too few trades …and over-optimised”? “
Good question Zig. The 30 odd SPA3 hEdge trades that are recorded in the publicly traded SPA3 hEdge portfolio did not constitute the only research. The results of the more detailed research are showen below. This research was conducted firstly across a broad spectrum of 56 world indices and then on individual indices before being applied to the ALL-ORDS as it has been.
Money management rules were then applied across the broad spectrum of indices and then to the ALL-ORDS and then finally to the publicly traded SPA3 Portfolio.
The research results across the 56 international indices from July 1996 is as follows:
With the SPA3 hEdge Money Management included the Average Proift trade rises by 50%:
This certainly is not a brilliant edge on its own. That is why it is traded in combination with a long edge on stocks. In effect, the two lowly correlated edges are overlayed over each other to play their own specific roles. The SPA3 hEdge’s role is to protect capital in deep bear markets. During strong bull markets that have shallow medium term pullbacks it will act as a handbrake on the long SPA3 edge. But when we have big bears……..
Over the research period the 56 international indices rose by 76.24% which means that the shorting rules have an edge in an environment that has a massive upward bias. Furthermore, more volatile indices have a better shorting edge using the SPA3 hEdge entry and exit rules.
The SPA3 hEdge results have occurred over an 8 year period that includes 2 juicy bear markets and the ALL-ORDS has risen just 10%.
Regards
Gary
Hi Gary,
Thanks – another very informative post!
re: “..The 4000 plus hours I invested into SPA3.. ” – that equates to about 2 years assuming 40hrs/week. Did this include researching edge strategies and software development?
Also would you have available the SPA3 public portfolio performance results on a month-end and year-end basis, so it can be compared with managed funds and managed futures that report on this basis?
What would be really useful, is if you already do continuously compare SPA3 public portfolio performance against other managed funds and managed futures, would you have those results available?
Many Thanks,
BG.
Response to Comment by BG:
“Did this include researching edge strategies and software development?”
It included all the research work which included plenty of programming and manual / visual backtesting. The 4000 hours did not include the software development of embedding SPA3 into a technical analysis package – that was extra and not done by myself.
“What would be really useful, is if you already do continuously compare SPA3 public portfolio performance against other managed funds and managed futures, would you have those results available?”
We do this research from time to time against managed funds but not against managed futures. We will update the research in the near future and provide a link to the comparisons. In fact, the bar graph on the home page of our website shows a comparison of SPA3 against managed funds.
Regards
Gary
Response to Comment by Bazza:
“It appears the fundamentals of the edge is to cut your losses short and let your profits run which is easy said than done.”
The two principles that the SPA3 edge achieves are 1. as you say, cut your losses and let your profit run, and 2. minimise your exposure during falling markets and maximise your exposure during rising markets.
As you also said, this is far easier said than done.
“Also I beleive in timing the market compared to time in the market as a crucial factor which is also difficult to do but can generate better rewards if done right.”
I believe in timing the markets and time in the market. Leaving the market altogether for periods of time runs the risk of not getting back in and hence missing big moves and also in getting out of form, a bit like a sports person not playing and losing form. It can take sometime to get back into form, a period that will inevitably include mistakes.
This is why the 2nd principle above of minimising exposure during falling markets and using a lowly correlated strategy like the SPA3 hEdge is important, it protects capital while you continue to engage and probe the market, not knowing when the falling market will end to again provide an endless stream of opportunites from which to profit by trading long.
Regards
Gary
Response to Comment by Max:
A few questions in this one that require some detail in the response.
“I [would] be interested to know your opinion on the drawbacks of trading a system that rates as ‘excellent’ on the PF-Win% chart,….”
Theoretically, there are no drawbacks ( and the benefits are stated above) if a system can be devised that has such a high expectancy provided there are plenty of opportunities to trade and that not too many trends (in the timeframe that is being traded) are missed.
However, what is usually found when expectancy is very high is that the system is highly filtered or has many criteria that define entry – and is hence over-optimised which leads to a lower probability of continuing to work in the future, i.e. lacks robustness. This usually results in few opportunities to trade and many trends being missed and also typically doesn’t compound that well resulting in a lower CAGR (compounded annual return). The more trends that are missed in out-of-sample testing the higher the probability that the system is over-optimised and curve-fitted to the in-sample back-testing data.
Also, non-directional systems (such as options systems) typically have high win rates with low profit ratios but fairly high expectancies. The problem with such systems is that they are leveraged strategies and require prudent money management discipline at the portfolio level such that an outlier event or sequence of events doesn’t wipe out all capital (plus more) in a short period of time.
“…..and has there been any ‘de-tuning’ of the SPA system to rate is as ‘good’ visa-vi ‘excellent’ to ensure that is it robust enough to produce consistent results and to suits the trading / investing profile of the typical SPA retail investor?”
No, there has not been any de-tuning. SPA3 captures a very high percentage of trends. It does this by using a couple of concepts that capture price action at different parts of a typical price action cycle and has few parameters hence a large degree of freedom. This is why it suits a typical retail investor, is robust and can produce consistent results over a large sample of trades.
When a system has a wide degree of freedom through using a small number of parameters, achieving a very high expectancy is difficult unless the system is designed to trade just a single market like a futures market in Soya or Gold or Copper or any of the other individual futures markets.
“Do you believe there are difficulties in developing an ‘excellent’ mechanical system that is robust enough to actually trade (i.e. – one that is not overly curve fitted)?”
Yes, absolutely, pretty difficult stuff. Especially if robustness is a key requirement to handle the unknown future price action. Typically, ‘excellent’ mechanical systems are usualy found in futures markets where they have been developed for trading just a single market. The problem with this that there is just a single sample of price history for that single market.
The major unknown is what the permutations of price action will be in the future and whether the system will be able to handle them. This would be similar to designing a system using just BHP’s price history and then only trading BHP when in reality BHP’s future price action could be similar to a combination of many 10’s or even 100’s of other stocks. SPA3 has been researched across over 2000 stocks and 1000’s of trades over 20 years.
“Or are there other drawbacks to trading a system that sits further away from the curve? eg – possibly drawdowns? (although my initial impression would be that DD’s wouldn’t be a function of which side of the plotted curves you’re on but risk allocation per trade.)”
Typically, the higher the expectancy (i.e. the better the edge and the further above the breakeven curve shown above) the lower the drawdowns and the less volatile the equity curve.
But expectancy doesn’t account for a number of things including: opportunity to trade, hold period, risk management, position sizing. Any one of these can cause unforeseen drawdown. IMHO the biggest reasons that a high expectancy system would cause a large drawdown would be too few opportunities to trade (trading system related) and hence 1 or 2 trades being a big loser (similar to a buy and hold portfolio that had Babcock & Brown and a couple of LPT’s like Centro, Allco and MFS in it) or taking too big a position size in a single trade (money management related). The other is the system not being able to handle an outlier event such as an options strategy handling RIO falling from $157 to $30.
Regards
Gary
In reply to a comment from: Irene [Visitor]
“However, its important to note that the success of any system is based on which stocks are bought, at what time and at what price. Even with a “SPA” edge the purchase of recommended stocks will produce completely different results depending on which of the recommended stocks are purchased at what price. Foe example, ten different people will have ten different financial results.”
Hi Irene,
I would like to clarify the points you raised as they should form part of the research for any trading system.
A researched and proven mechanical trading system should clearly define what stocks to buy and when. The signals must be unambiguous. If multiple opportunities are thrown up it shouldn’t matter which trade is taken, as theoretically all entry signals form part of the long term edge. However, the edge spoken about in the article does not include money or risk management that would adjust your exposure to the market in any trade based on additional researched criteria. Good money and risk management criteria can not make a negative edge positive but they can turn a good edge into an excellent edge and/or smooth out an equity curve.
The price at which a stock is purchased or sold becomes more relevant as the average hold time decreases. For example, SPA is a medium term trading methodology with an average hold time of 8 weeks. As such, entering or exiting a SPA trade with a few cents (or small percentage) +/- price difference will not effect the long term results. In a short term day trading strategy or where leverage is applied, +/- 0.5 cents will make a big difference. This ‘slippage’ should be part of your research and take into account the worst case scenarios.
It is true that there will be variability between portfolios trading with the same methodology but taking different trades. This will be more noticeable over the medium term. However, if your research is thorough, your goals conservative and you follow your trading plan, then 95% of the long term variability should be on the upside. That is you should at least achieve your goal. The goal of SPA is to yield returns of 10-15 compounded percentage points p.a. better than the ALL-ORDS over a rolling 5 year period. We know that most long term customers have achieved results within this range and better. If you were to Buy and Hold, the risk of not achieving your goals is much greater; most people believe the opposite.
No feedback yet!