This blog continues on from last week where I posed the question: “How can I, in advance, eliminate the fairly good chance of selecting a poorly performing long term portfolio, even if I re-invest dividends?”
There are two approaches of ensuring that one does NOT experience portfolio performance similar to the poorly performing 10-stock portfolio discussed over the last 2 weeks and, even worse, ensuring that it is not worse than that.
The first is ensuring that your stock selection, many years in advance, is simply brilliant. The second is to become more active either by introducing systematic risk management, exiting and selecting different stocks over the lifetime of your portfolio or becoming a more active momentum investor. Or a combination, to some degree, of all three.
The first approach, relying on brilliant stock selection, is fraught with risk because it is difficult in the extreme to know what is going to happen so far into the future, as has been shown in the previous two blog postings. The second approach requires active investment to some degree or another.
The scenario of introducing systematic risk management was covered last week. The scenario of exiting and selecting different stocks with the same position size as the exited stock during the lifetime of the portfolio wouldn’t have improved the best scenario as we had already, with the benefit of hindsight, selected the best stocks over the period.
Moving out of the poor stocks into the better stocks during the life time of the portfolio could have improved the worse-case scenarios. Easier said than done. Unless you have a specific process devised, based on much research and reading, you may make more mistakes and make the situation even worse.
Let’s investigate the active momentum approach. The main benefits of such an approach are:
- One does not need to be a brilliant stock picker in advance. With active momentum investing the stocks pick you as they come to the fore.
- More sensitive systematic risk timing mechanisms are used ensuring that one is 100% in cash during most of the primary bear markets and even some secondary bear markets.
- The worst case momentum investing scenario is far far better than the worst case for picking stocks. This is the main benefit as I will show below.
- More active momentum portfolios will perform better than long term stock picking portfolios putting the odds in the favour of the active investor.
- One picks up fantastic financial skills along the way.
The main disadvantages of active momentum investing relative to a long term stock picking approach are:
- It takes more time to manage an active momentum portfolio.
- One has to learn the psychological aspects of active investing and to stick to their plan. Whilst some view this as a disadvantage, to most active investors this is seen as a positive by-product of the active investment process.
Having established the upper and lower limits over the previous two blogs for buy and hold portfolios that re-invest dividends, let’s now explore the outcomes of an active momentum strategy that uses systematic risk management, stock timing and simple but sophisticated money management.
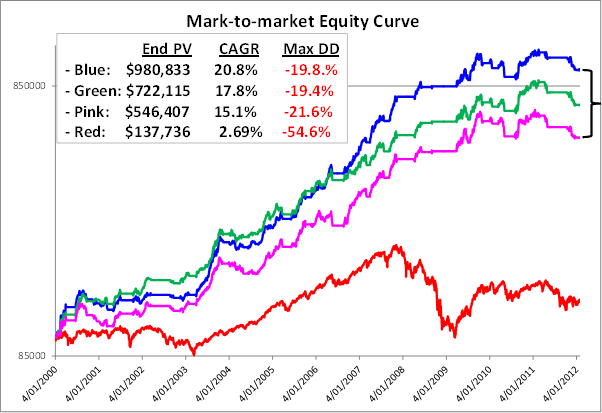
The graph above shows the 5 (blue), 50 (green) and 95 (pink) percentiles of a 1000 portfolio simulation over the same 12 years as the buy and hold portfolios but now using an active momentum strategy where the average hold period per trade is around 6 weeks. The straight horizontal lines are when the portfolio was in cash.
The active momentum portfolios above do NOT include interest and dividends which would obviously only further improve returns.
The CAGR to Maximum Drawdown ratios (CAGR ÷ Max DD), which are an excellent method for calculating the rewards received for the risks taken, are simply outstanding.
These portfolio outcomes could realistically have been achieved by active investors that followed the same simple processes that are used in the simulation. Indeed, investors using this active strategy should perform somewhere between the blue and pink equity curves.
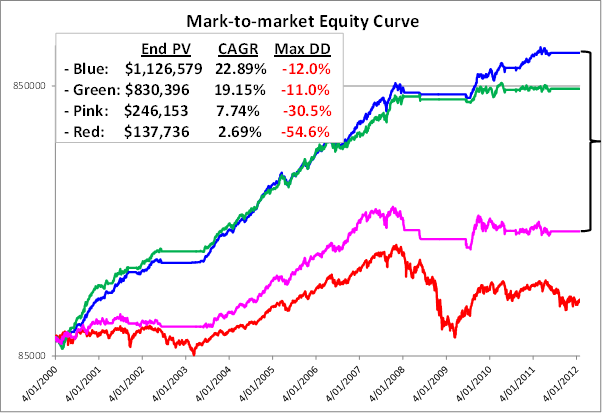
Now compare this to the same upper and lower limit chart for the buy and hold portfolio that re-invests all dividends firstly without systematic risk and then with systematic risk.
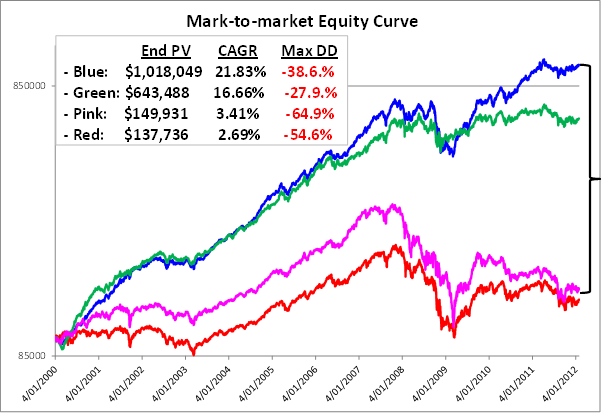
Remember, the blue equity curve is a near best possible portfolio that has used the benefit of hindsight to select the best performing and dividend paying stocks over the 12 year period. It omitted all poor performers and, hence, is an unlikely outcome for almost all buy and hold investors. Refer to the posting two weeks ago for the list of stocks that comprise this portfolio and their individual performances over the 12 year research period.
The first glaringly obvious observation is how much better the worst case outcomes are for the active momentum portfolios compared to the long term portfolios with dividends re-invested. This answers the prime question posed for this blog.
The second glaringly obvious observation is the massive difference in the gaps between the blue and pink equity curves in the three charts. This means that the potential to achieve better returns are well and truly there for active momentum investors without needing to take the huge risk of being wrong with the tough caper of having to select the right stocks in advance.
The daily process for deploying the active momentum strategy is 10 – 15 minutes a day. A small price to pay for peace of mind that removes the pressure of having to select the best performers many years in advance and eliminates the possibility of experiencing the pain of a large drawdown such as the 2008 primary bear market.
This concludes this four part series on this subject.


Gary
is it possible to compare these strategies from a more recent common start date? Say 4/1/2009. Lets face it, the biggest “gains” have been in periods where the active portfolios moved to cash to avoid a loss. A comparison of active momentum investing vs just holding the ASX200 over the past 3 years would be interesting.
The research results speak for themselves – active momentum is the way to go. Problem is your numbers are based on portfolio management every day – 365 days of the year. Who can do that? I have found holiday breaks change results a huge amount and introduce good or bad luck timing issues. For me the breaks have generally caused me to miss runs up and then always catch the runs down. The result is always significant draw down. What is the answer to this?
i use the ‘kiss’ principle in investing, my first rule in , ‘ingot i trust’, my second rule is, ‘in Gary i trust’.
Hi Gary,
There is no doubt about the results of active momentum stock portfolio management, I just want to say that in my former life as an Australian Tax Accountant, I had a client who was a very successful businessman (I’m sure you would know of him if I mentioned his name), always very busy, who managed all his own investments, many millions of dollars, and was a stock picker,who consistenty returned better than 30% every year. He invested in markets around the world. What made him special was that he had rules that he never broke. One rule was that every 90 days without exception, he went through his portfolios with an eagle eye and sold every stock that was underperforming, and replaced them the same day with new stocks. He never flinched at taking a loss, and was never overawed by big profits, and during the 90 days inbetween he kept himself informed of the market conditions but never moved to change his portfolio selections. He also never flinched when it came to writing a cheque to the ATO!
I saw him lose $30,000 on Burns Philp in 90 days, and profit more than $200,000 on CSL over a year or so, and when I asked him how he felt about that he said that it was just par for the course, just the trading game. He kept his many portfolios to 30 to 40 stocks all year long, and was indifferent emotionally to profits and losses. But he loved making money!
This real life story supports your view that (1) you must have rules (2) you must actively manage your portfolio (3) you must have some predetermined method for culling and replacing stocks, and (4) you must stick rigidly to your rules.
And most importantly, it bears out my philosophical belief that the only way to live with uncertainty is to be yourself certain of what you will do in the face of that uncertainty. We make our own rules in the stockmarket game, otherwise there are no rules. No rules, always uncertainty. Make rules and you live with certainty in the face of uncertainty. If you take the age old statement “buy low, sell high”, and search your mind for the questions that are inherent in that simple statement, you must answer that to successfully follow that golden rule, you must create certainty in the face of certainty, you must develop the best and most effective rules possible to be able to buy low and sell high. This is what makes the difference between great investors/traders and the worst losers.
I could write a book on the philosophy of “buy low, sell high”, but not this year. And not today, the markets are open, and I can only do one thing at one time! Women can do more, but that’s a story for another place and time.
Cheers,
Mike Cullen
I have a friend who has funded an independant lifestyle without needing to work for about 40 years,(he retired at 27).His tactic was to be a buy/hold big cap dividend investor.
With clever tax planning (no capital gains tax),the dividend stream has funded a more than comfortable lifestyle.
His other tactic has been to buy after significant market falls.
Ron
Hi Gary,
thankyou for the excellent and illuminating research.
Have you researched an active momentum long-short strategy that trades short when the market risk goes high, instead of moving to cash?
I’d expect this to outperform the long-only strategy, but the research would need to confirm this.
In reality short equities trading may not be practical for a retail investor, so perhaps could be applied using CFDs with controlled leverage.
Or alternatively, the strategy could perhaps be applied to FX with some adaption for the long-short switch.
Thanks,
Ern.
Response to Comment by Murray:
Firstly, yes we can compare these strategies from the beginning of 2009. Will do a future blog on this.
Secondly, the biggest gains are NOT just the periods when the portfolio was in cash. From March 2003 to November 2007 the All Ords was up nearly 140% to its peak. The SPA3 public portfolio was up nearly double what the All Ords was over this period, at around 263%.
Thirdly, we run a public portfolio that is ALWAYS in the market, that is, it takes signals in all market conditions. It uses what we call Risk Profile 2. This means that the risk/money management strategy that it uses calls for reducing the position size of new trades in a High Risk Market period to either 2/3rds or half a position. That portfolio is currently up 372% compared to the All Ords being up 55% over 12 years.
This shows that it is not just being in cash during the down markets that produces the outperformance.
The outperformance comes from both doing far better than the index during ‘up’ markets and keeping your powder dry during ‘down’ markets, regardless of Risk Profile that is used. Easily seen on historical equity curves, far more difficult to do in the heat of the moment.
One of the main benefits of a researched mechanical system is that it calls you to take action, either to get in or to get out, when you least expect it.
Regards
Gary
Response to Comment by Ern:
We have spent many man hours researching mechanical shorting signals.
As yet we do not have a productised shorting system for a whole lot of reasons the least of which is the discomfort that most have with shorting.
Also, the outcomes of going to cash during High Market Risk periods provides excellent results anyway and the active investor gets to have a break from trading.
Regards
Gary
Response to Comment by Brian:
Firstly, it is not a 365 day a year proposition because deploying Systematic (Market) Risk in one’s portflio means being in cash for many weeks and sometimes months at a time. For example, in 2011 there was a 5 month break from 6 May to 14 October. Perfect timiing for a summer holiday in Europe!!
Seriously, it would be nice if one’s holidays co-incided with High Market Risk periods but this is not always the case.
I have had both occur with me when on extended holidays. That is the market rose strongly while I was overseas for 6 weeks and out out of the market and have also had the benefit of being away on holiday and out of the market when it fell sharply.
There are solutions like having a trading buddy to monitor your stocks for you (and you for him/her when applicable). Or taking a tablet with you and using remote login to your ‘home base’ computer or taking a laptop with you whereby you can transact as if you were at home. You can also pay a broker that knows SPA3 to be a ‘caretaker’ of your portfolio at a slightly higher brokerage rate per trade.
There are ways…..
Regards
Gary