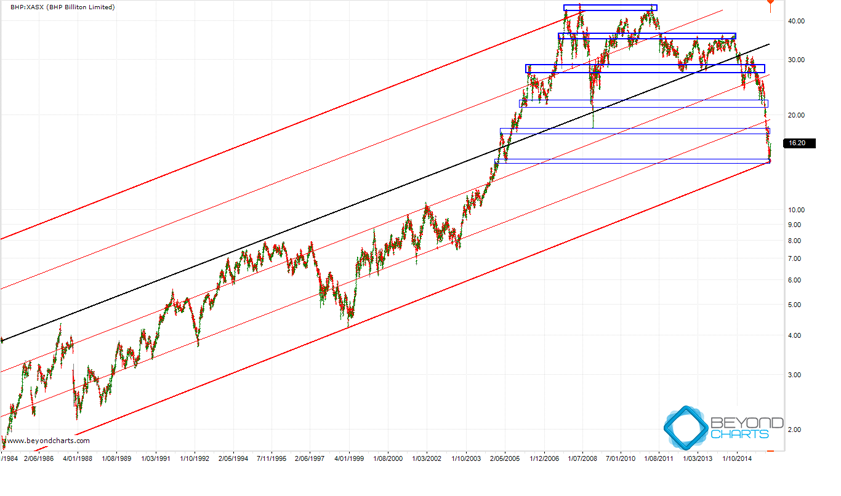
The 32 year logarithmic chart below shows the channel in which BHP’s share price has moved over this period. The black median trend line shows the controlling gradient. The two outer bold red trend lines are the upper and lower channel lines and the thinner red lines are support and resistance trend lines reached along the way.
The blue horizontal lines show support and resistance zones over the last ten years or so. The lowest support zone between $14 and $14.50 is a weak support zone, but coinciding with the lower channel line adds more significance to this support zone. Having said that, there is no rule that says the lower channel line has to hold.
Furthermore, BHP’s share price has already experienced a near 78.6% retracement of its ten year share price run-up from 1998 to April 2008. This is a large Fibonacci retracement by any means.
One may conclude that there is far more upside for BHP’s share price than downside.
 Source: Beyond Charts
BHP’s share price has bounced sharply off the low $14’s where the lowest support zone and lower channel line coincide. Technically, this was expected, at least for a few trading days. The questions are: is this the bottom and will this support zone hold if BHP falls back into the $14 range again, or will BHP continue to plummet lower?
Let’s get the negative side out of the way first. If the $14 to $14.50 support zone doesn’t hold then the next support zone below the lowest displayed zone is $10.25 to $11.25. This is a long way away and probably constitutes a ‘plummet’! Which best describes what has happened since the $22 area.
On his TV show last week Peter Switzer asked whether I would be a buyer of BHP given these circumstances. To which I replied, “No, because I need to have some technical evidence that there is a high probability that the down trend has changed to an up-trend.”
However, I can understand that contrarian investors might have a different view. One that determines that BHP is massively oversold, has more upside than downside, and is paying one of the highest yields that it has in decades, maybe ever! That may change in a month or so when BHP announces its much anticipated dividend. Let’s wait and see.
I am not a contrarian investor mainly because I am a medium term investor with an investing horizon of months whereas contrarians, in the main, are prepared to take a position in an ‘oversold’ large cap stock for many years. Given BHP’s current scenario the case for this type of tactic probably looks better now than ever.
Regardless of your investing style there is a risk/reward case for buying BHP at these levels given the current technical setup. M investing style would demand that one also predefines the maximum risk that one is prepared to take in the position. Technically the simplest approach would be to enter after a down day or two in the current price area, and predefine one’s risk by having a stop loss marginally below the current support zone, perhaps somewhere between $13.50 and $13.75 (not placed in the market until in the price is reached).
For myself, to answers Peter’s question more specifically about when I would buy, currently that would be if BHP break’s above $16.89, based on my mechanical longer term volatility momentum process. And I would have an unambiguous trailing stop loss for that position being the predefineded risk that I would be prepared to take for the up-trend to prove itself and to limit my loss should the market do what it does and BHP’s share price falls. If BHP’s share price falls below $14.20, which is its recent lowest close price, then that break out price of $16.89 to enter would also trail lower.
Gary Stone is the Founder and Managing Director of Share Wealth Systems.

