
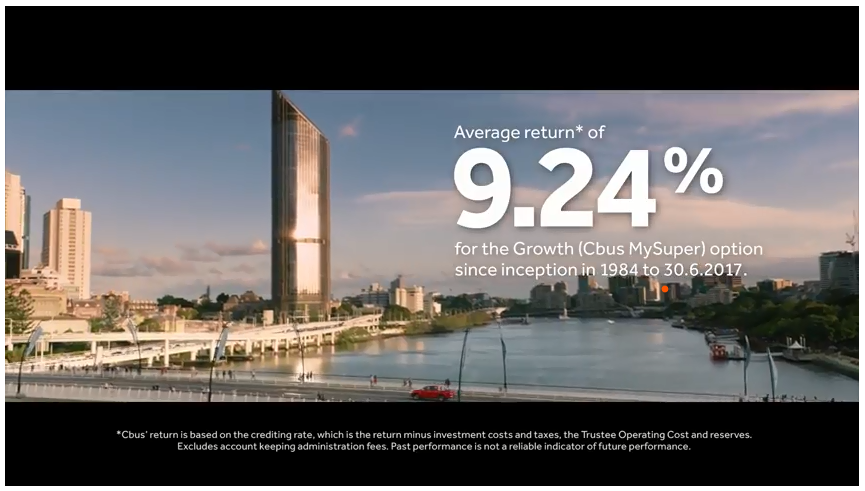
I saw this CBUS advert on TV just recently. It got me thinking…
Get ready for the barrage of advertising that you will be subjected to in the struggle for your saving-for-retirement dollar.
The catalyst for the unrelenting barrage that is about to be unleashed is the recently started media discussion about products that should be on the Top 10 My Super default funds list, a proposal put forward by the Productivity Commission last month.
I would like to help everyday investors put into perspective the returns that will get splashed around in every place that your senses might spend their time…
The CBUS average return of 9.24% p.a. over 33 years sounds great. But nothing is great without context. So, let’s put some realistic context around the information in the image.
This is done by comparing it to practical and easy-to-execute alternatives.
The very first comparative benchmark to use is the All Ordinaries Accumulation Index (same as a Total Return index). Over the same period of 33 years the All Ordinaries Accumulation Index achieved an average return of 11.38% p.a.
Most everyday investors’ reaction would be that the 2.14% p.a. outperformance wouldn’t be that much in absolute dollars.
WRONG! It’s huge.
But before we calculate how huge it is let’s try to get an apples-to-apples comparison, which is not that easy.
Firstly, we’ll presume an average starting account value of $20,000, which is well above average for a young worker.
Secondly, the CBUS 9.24% p.a. does not include all fees.
The small print in the image above says that “account keeping admin fees” are excluded. A search of the CBUS website reveals that this is $78 per year. Over the 33-year life of this portfolio, that apparently small fee actually equates to 0.11% p.a.
So, the real return for CBUS is 9.13% p.a., not 9.24% p.a., a significant 2.25% p.a. below the All Ordinaries Accumulation Index.
Now you cannot invest directly in the All Ordinaries Accumulation Index but you can invest directly in the ASX200 ETF(STW) or the ASX300 ETF(VAS), both of which essentially mirror the Index and therefore would have achieved almost the same as the All Ords over 33 years, with dividends reinvested.
STW’s annual management fee is 0.19% p.a. and if we retain the same 0.11% p.a. admin fee, the annualised return would have been 11.08% p.a., making it 1.95% p.a. better than the CBUS Growth fund.
So, how much is a 1.95% p.a. better result in absolute dollars over 33 years, starting with $20,000….
| Starting Balance | Ending Balance | |
| CBUS Growth fund at 9.13% p.a. | $20,000 | $357,426 |
| STW at 11.08% p.a. | $20,000 | $641,229 |
That miserly 1.95% p.a. better performance would give you an additional $283,803 or 79.4% in your retirement account!
That miserly 1.95%p.a. better performance, removed a massive 17.95% from your fund’s potential profit every year, on average.
Not so great anymore…
To make it clearer, that miserly 1.95% actually equates to you handing over a massive 17.5% of your fund’s annual profit every year, to the fund manager. You could call that an under-performance fee!
Or to put that in dollar terms, you would have ‘handed over’ an average of $8,600 EVERY year for 33 years as an ‘underperformance fee’.
And that’s for somebody starting with $20,000. For somebody starting with $50,000, the ‘underperformance fee’ would have been $20,900, on average, EVERY year for the 33 years!
Would you be prepared to be invoiced for such an additional fee every year for 33 years? It’s pretty much the same outcome without the explicit invoice!
This blog has two purposes:
- To prove the power of compounding, which unfortunately most don’t fully comprehend.
- To not allow the power of advertising to pull the wool over your eyes and to conceal a truth, a truth that says over the long term the lowest fee, highest performing asset class is the best place for you to invest your long-term investments.
An Exercise for you:
Odds are your fund hasn’t done as well as the CBUS Growth fund over 33 years so you will be even worse off.
Wherever in the world you are this simple benchmarking exercise could mean 100s of 1000s more dollars for you…
This same simple benchmarking exercise can be done against the S&P500 Total Return index for U.S. residents, the FTSE100 Total Return index for UK residents.
How can I learn more about this exercise and about investing better?
Share Wealth Systems has recently released a generic online training course that demonstrates the major investing principles at work that more people should understand, such as highlighted in this blog.
You can get access to this online course here…
This is what has been said some of the first tranche of students:
“While not all of the information was new to me, it was presented in such a concise way that it’s prompted me to take action where other courses/books have not. I think primarily because there were detailed strategies to follow with exact action steps to take.
This is huge for us and not something we’d be considering or comfortable doing had the Investors Club course not laid things out so clearly.
So, there you have it. Big changes on the way from completing the course.” Andrew
“Gary Stone’s Blueprint to Wealth Investors Club Course is the best of its kind that I have come across.
It has helped me greatly and I am using it to help me plan and execute my Investment Plan for my retirement. I strongly recommend it to others as I know that they will benefit greatly if they use the information and insights that Gary has provided in this excellent course.” John W.
“An excellent way to learn financial literacy and skills to manage an individual’s financial future.” Alan J.

