Last week we looked at the potential upper and lower limits for ASX dividend re-investing buy and hold portfolios. I posed the question of how systematic risk can be mitigated and how the worst case stock selection can be avoided.
Before getting into these answers we should quickly explore the difference that re-investing dividends makes in a long term buy and hold portfolio. Remember, receiving a dividend is like manifesting cash from thin air which are immediately deployed back into the market. This is the performing 10 stock portfolio from last week where the black equity curve excludes dividends and the green includes dividends.
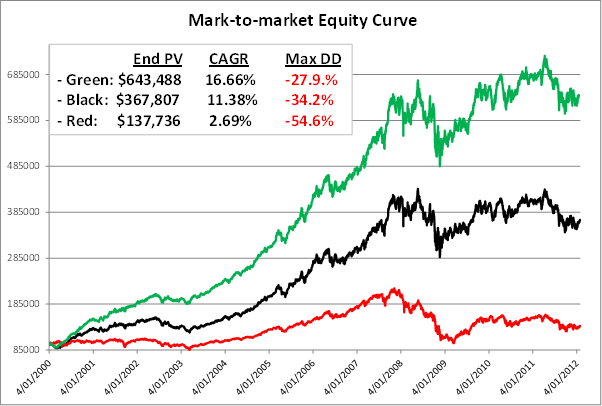
That’s a 75% improvement in returns by re-investing dividends! In the 20 stock portfolio discussed last week the improvement in returns was even more stark, $543,526 to $1,018,049, or 87%! For the poorly performing 10 stock portfolio the improvement was 99% from $75,139 to $149,931. Remember that re-investing dividends also increases your shareholding which means that your returns are compounded.
This seems too good be true. But it can be better.
Of course, there are the minor requirements that you pick the right stocks and that you stay the either distance in these stocks through thick and thin regardless of what ‘noise’ you are subjected to over the years, or you have a timing mechanism to exit and re-enter them appropriately.
Let’s look at systematic risk. Systematic risk is the risk that a portfolio is subjected to due to negative sentiment towards the overall equities market. The reasons for the negative sentiment could be anything ranging from geopolitical, terrorist activity, inter-market movements, wars, natural disaster and even reasons that may not exist yet! Some last a few days and others for months or even years.
Using a timing mechanism to mitigate systematic risk can improve performance dramatically. More importantly it can be very liberating knowing that you have an objective shut off value should sentiment become too negative, regardless of the reason.
So let’s revisit the same three portfolios from last week and see how using a simple systematic risk management timing technique can potentially improve performance. I decided to use a very simple and delayed timing technique to minimise effort for the near-passive investor. The emphasis on simple and ensuring that the passive investor did not need to become too active.
The approach is to close down the portfolio and go 100% into cash when the All Ordinaries fell below its 200 day exponential moving average for five consecutive days and to re-enter the market when the All Ordinaries rose above the same EMA for two consecutive trading days. This simple timing mechanism would have resulted in 17 portfolio exits into 100% cash over the 12 years. Using a simple rather than exponential moving average would have resulted in 8 portfolio exists into 100% cash.
The difference that this would have made for the poorly performing 10-stock portfolio is quite dramatic, a 64% improvement! And what about the huge improvement in the pain measurement, maximum drawdown, more than halved down from 65% to 31%? The red line is the All Ordinaries index.
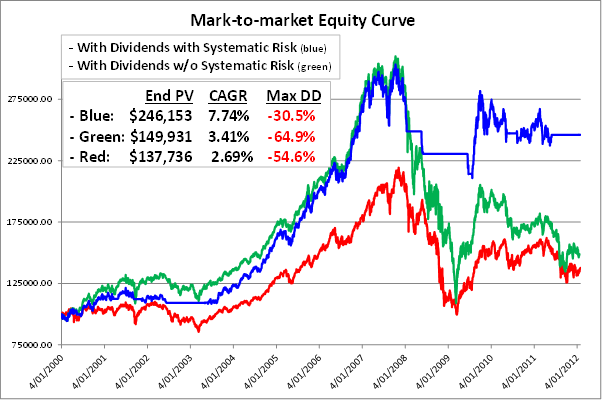
Let me put the green equity curve into perspective by pointing out again that the red equity curve, the All Ordinaries, can be used as a proxy for the average equity managed fund’s performance over the same period, including managed fund fees! This means that even the green equity curve above, as poor as it seems, would have outperformed most equity managed funds!
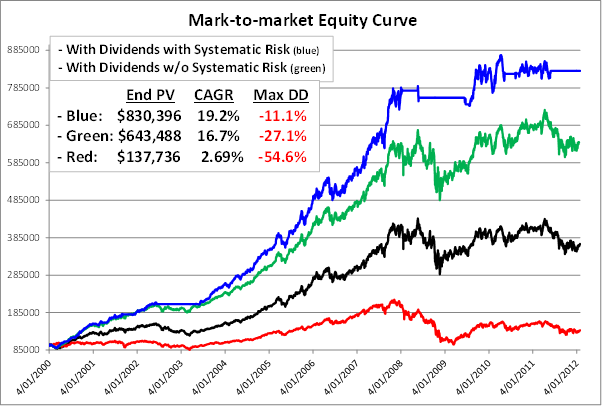
With the performing 10-stock portfolio the improvement from deploying a simple systematic risk management strategy over the 12 year secular bear market period would have been 29.1% in returns and a huge reduction in maximum drawdown from -27.1% to -11.1%!
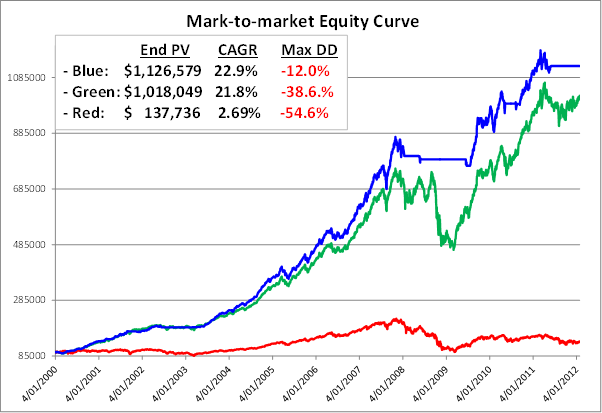
With the performing 20-stock portfolio the improvement from deploying a simple systematic risk management strategy over the 12 year secular bear market period would have been 10.7% in returns and a huge reduction in Maximum Drawdown from -38.6 to -12%!
The portfolios that used systematic risk timing exclude interest returns (3 blue equity curves above) when the portfolio was 100% in cash. Interest on cash would have further improved performance of these portfolios by an estimated 7% – 8% over the life of each portfolio scenario through raw return and compounding.
Notice the massive growth in the green equity curve in the 20-stock portfolio from early in 2009. This was mainly due to the lesser stocks in this portfolio such MND, RHC and ALQ. They started rising early in 2009 while the blue equity curve was still 100% in cash.
Many investors would have (and did) close down their portfolios on the way down during 2008 and probably did not re-enter the market until well into 2009, if at all, missing out on a large part of the 2009 run-up.
Looking at all three scenarios, an observation may be that the better the stock picks the less improvement that systematic risk management seems to have.
However, this is with just one fairly delayed near-passive market timing mechanism and with possibly the best hindsight selected 20-stock portfolio available on the ASX over the 12 year period.
What if a slightly more sensitive market timing mechanism was used where there were more occasions and earlier in the down cycle over the 12 years that the portfolio was moved 100% to cash.? Or a different not-so-good portfolio was selected?
This is the realm of research that one should embark on to answer such questions. The point is that even with the simplest and least sensitive of timing mechanisms, an investor with the inclination to do so can derive significant benefits by putting some focus into systematic risk management rather than only dividend paying stock selection.
Next week we look at the most important question to answer in this series on this subject which is: “How can I, in advance, eliminate the fairly good chance of selecting a poorly performing long term portfolio, even if I re-invest dividends?” That is, remove the possibility of the worst case outcomes, or close to them.


I look forward to next weeks rendition.
Choosing the right stock form a list is always the big burning question.
Picking from a “list” is stupid (IMHO)
I’d expect that the SPA3 program would set out a simple way you to “hands free” your selection so that you could sit back and have a cup of coffee (or stronger) even while you “worked”.
Pity I don’t have the saved-up funds to spare… I only have borrowed funds !
It would be a great help if you gave an explanation below the charts for the abreviated codes you use – End PV, CAGR, Max DD
Thank you for your help.
Blessings,
Fred.
Response to Comment by Fred:
End PV = End Portfolio Value which means the portfolio value at the end of the research period, having started with a portfolio value of $100,000.
CAGR = Compound Annual Growth Return which is the average annual compounded growth in percentage terms.
This is very different to the arithmetic average. For example, the arithmetic average for growing $100,000 to $1,126,579 = 85.5% { (1126579-100000)/100000*100/12 where 12 = years) } whereas the compunded average = 22.9%. Be careful because most fund managers and market commentators quote the arithmetic average. Very naughty of them – arithmentic average almost always looks better!
Max DD = Maximum Drawdown which is the maximum percentage fall that a portfolio experiences from it’s highest value ever reached prior to the fall. This is the maximum ‘pain’ that an investor might experience.
Trust that this helps.
Regards
Gary
Response to Comment by Peter:
If SPA3 was automated to the point that, using technical analysis criteria, it selected a single stock from a list for each trading day’s scan then all SPA3 users would be pointed to the same stock which would create liquidity issues in the market with everybody chasing the same stock. This is why stock picking newsletters can be dangerous, especially when illiquid stocks are recommended, because 100’s or even 1000’s of users are recommended one of two stocks on any particular trading day. For example, if a stock averages turnover of $500,000 a day and 1000 newsletter subsrcibers are recommended this single stock and each subscriber wished to place, on average, $3000 into the trade, the increased demand of $3M chasing this stock would have a massive effect by pushing up the stock’s price.
That said, with SPA3 we don’t need to come up with a single stock from a list because rigorous historical portfolio simulation research has shown that you can choose any stock from a SPA3 Scan list on any given trading day and still massively outperform the market, even you pick a stock on any particular day that ends up being a losing trade. By selecting randomly from a list you will also pick winners.This is the beauty of using a researched mechanical system that has an edge, you don’t need to pick the stocks, they pick you! You should read The Trading Manifesto that I wrote which you can download from here -> The Trading Manifesto.
Furthermore, investors have different portfolio sizes and risk profiles and hence can only trade stocks with liquidity that their respective portfolios can sustain. When one has a portfolio management mindset rather than a stock pickiing mindset one needs to raise ones paradigm to that of managing and growing a portfolio rather picking the ‘right’ stock.
Regards
Gary
I find this research very interesting. Looking at my Intelledgence portfolio(with the stocks I currently hold) and applying 200/40 ema crossover, this systematic would have cost a deal of money, somewhat less drawdown but not enough to warrant the overall gain achieved by staying in. I guess it gets back to stock selection being very important, and closing out when your picks are going against you.
Hi Gary,
I am keen to know which of these long term exit signals you would recommend after all your research because there seem to be so many to choose from it is a bit confusing for the layman.
What about for example a final exit when the 150 day ema goes down through the 365 ema and final re-etry is the converse?
which one would you use on a medium to long portfolio?
Thanks for your help
Response to Comment by Justin:
Research has shown me that when using conceptually sound exit mechanisms, the different exit mechanisms will exit on different dates on an individual signal basis, sometimes earlier and sometimes later than each other, but over a large sample the statistical difference will not be that much different.
Of course this statement depends on what ‘conceptually sound’ means. It’s definition will also be dependent on the objectives trying to be achieved, in this case a long term safety exit mechanism.
And by statistical difference, I mean wrt to an edge, or mathematical expectation (search this blog for explanations).
Whilst I have done some testing, I haven’t done extensive research with these specific exit mechnaisms to make that statement. I just know this from researching many different exit signals for different timeframes of trading.
Using any will be far better than using none at all. In some circumstances one will be better that the others but worse in other circumstances.
The EMA150 & EMA365 simple crossover that you mention would be too delayed in my opinion for both exit and re-entry. It may just suffice as a safety exit for long term trading but IMO would definitely be too delayed for re-entry.
This poses as a problem because if you use some other timing mechanism for re-entry then the 150/365 won’t be in place for the exit as the EMA150 will still be below the EMA365……….
Which one suits you will require research which, wrt investing, is your ‘net practice’ or ‘time on the driving range’ or ‘pounding the pavement’ preparing for the ‘match.’
Regards
Gary