It is two months since I last analysed the ASX benchmark indices for the Switzer Super Report when I asked the question, “will the ASX’s significant support zone hold?”
At this stage, using a subjective ‘rule’ that I have observed over the last twenty years or so, I can report that the ASX’s significant support zone has indeed held, whether the ASX200 or All Ords index is analysed.
The significant support zone is between 4925 and 5000 on the ASX200 (Code: XJO).
In the candlestick weekly chart below this support zone is shown by the blue rectangle that runs horizontally through the middle of the chart.
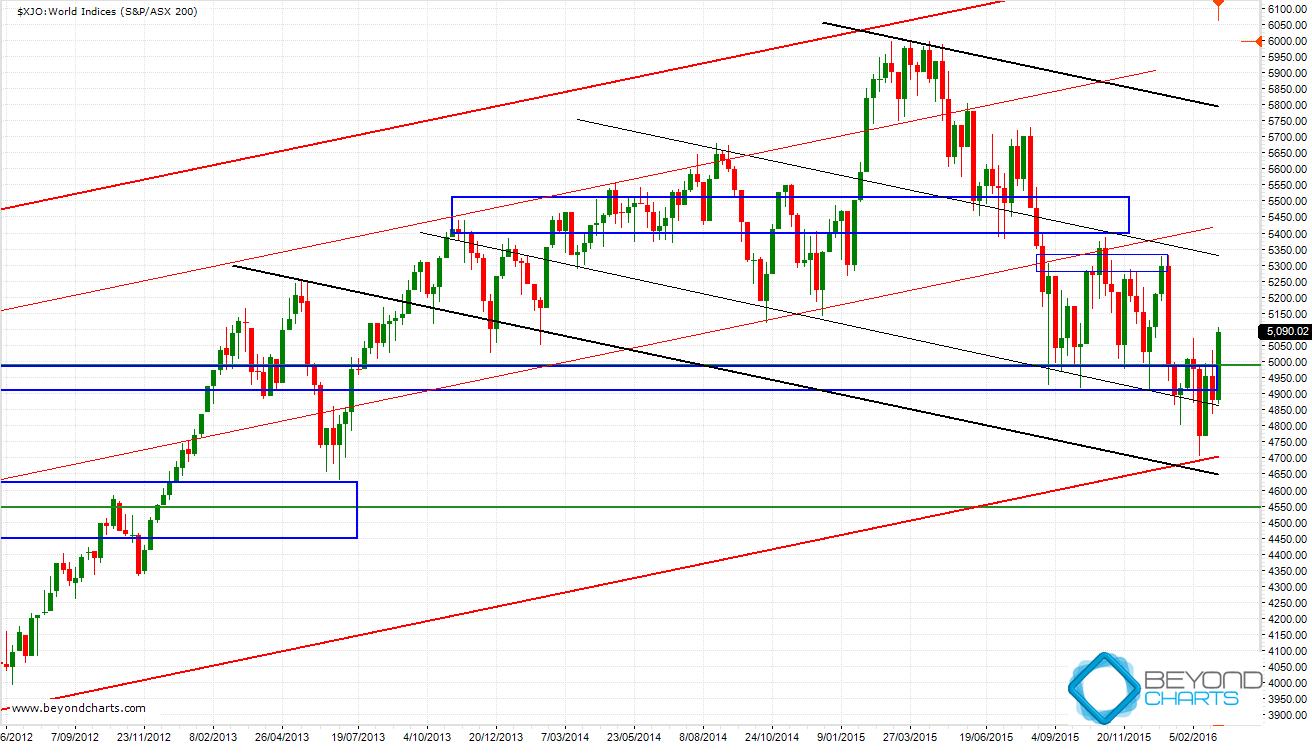
This is a significant support zone for a number of reasons. Firstly, it coincides with the mid-point retracement level of the 2008 bear market, that is, a gain of 50% of the fall that occurred in 2008. Secondly, this zone has been a resistance area and a support area on numerous occasions since November 2009, each time making the area a more and more significant technical zone.
The subjective ‘rule’ that I use is that an index can fall below a support zone for up to 7 trading days and then must rise back into the support zone for the support zone to be deemed to have held. (The same applies to a resistance zone with vice versa price movement.) Since January there have two 7 day closes below the support zone and one 5 day set of closes, hence my analysis that the support zone has held… so far.
Last week’s big green candle indicates that buyers have regained control over sellers. This was achieved on the back of rising volumes during February which adds some more credence to the rally.
Also shown on the chart are two long term channels indicated by the upper and lower bold red rising trend lines, a rising channel, and the upper and lower bold black declining trend lines, a falling channel.
The bigger picture analysis is that the ASX is still in a primary down trend and needs to rise above some overhead resistance levels to be deemed in a longer term up trend again. The first good news, besides the horizontal support zone holding, is that the lower bold red trend line of the seven year rising channel has held. As has the down trending channel lower bold black trend line.
The overhead resistance levels include the two horizontal resistance zones shown in blue on the chart and the two thinner red and black trend lines which all coincide in roughly the same area. This means firstly reaching 5400 and then rising above 5500 and remaining above this level for at least 7 trading days.
To achieve this will require that the both large cap resource and financial stocks play a role in pushing the index higher. The large cap resource stocks have started playing their role with both BHP and RIO providing entry signals on our longer term timing system over the last 2 to 3 weeks. The question is whether they will continue to rise and help push the index higher or at least keep it above this significant support zone? Or will they fall to their trailing stop levels and take the wind out of the sails of this greenshoots rise on the stock market?
Gary Stone is the Founder and Managing Director of Share Wealth Systems.


As usual from Gary , excellent review of the Chart and its implications. Thank you.
Hi Gary,
Thanks for your analysis.
Does the “7 day rule” apply to all “strengths” of resistance ?
Maybe bands of stronger resistance are simply wider, e.g. in this case between 4800-5000 rather than 4925-5000 so you then wouldn’t need the 7 day rule.
Gordon,
There is discretion on this one hence it being a ‘rule’ and not a rule. :).
It definitely applies more to significant support & resistance zones than the minor ones. I show the minor ones in a thinner blue rectangle.
Let’s define significant: tested as support and resistance multiple times; can be wider if you wish to bring that in but the wider must be supported by technical evidence.
In this instance, technically I can’t see evidence for the bottom of the zone going lower than 4900, maybe at a push to 4880 but no lower.
Regards,
Gary