In one of the portfolios that I trade, which is executed on the NASDAQ, I recently completed a trade whose price movement amazed me while I was living the trade. I’m sure that you’d be surprised to hear this from somebody that has been trading and researching the financial markets for over 20 years.
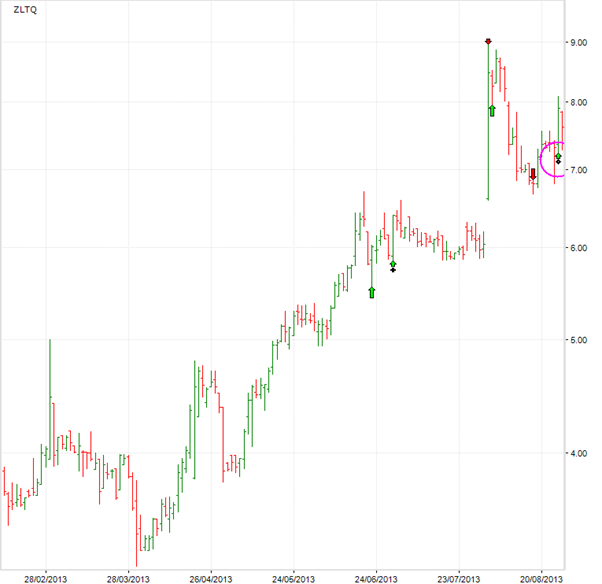
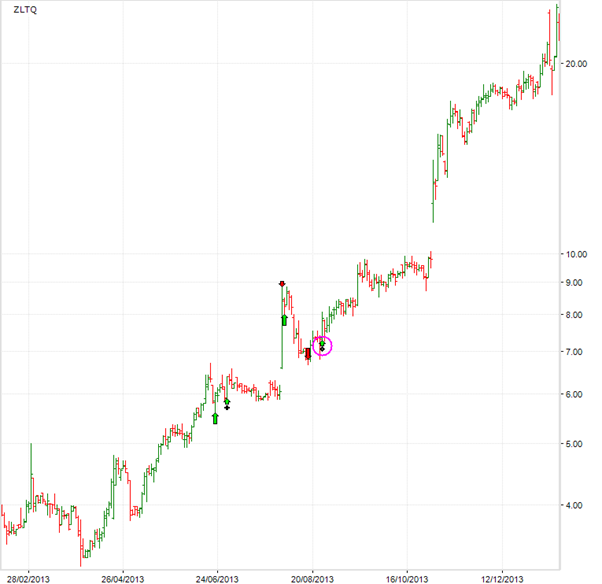
Let me tell the story as it unfolded and then I’ll discuss whether it was the perfect trade. The first chart shows the original entry signal in ZLTQ, Zeltiq Aesthetics, shown by the magenta ellipse. We enter the trade using a Market on Close order which gets a fill at the close price on the trading day following the end-of-day (EoD) entry signal, in this case $7.61, on 27th August.
In the five months leading up to this entry signal the price in ZLTQ had risen from a trough of $3.20 to a peak of $9.00 before retracing to $6.67 in late August 2013. Two mechanical trades were completed leading up to this trade entry, one a 38% profit and the second an 18% loss, both depicted by the green and red arrows on the chart.
A subjective trader might have pondered on the question: “Was this trend over or did it have more to go?”
As a mechanical trader I don’t go looking for confirming or contradicting information. I don’t even try to answer the question as it has already been answered. I pull the trigger based on the known probabilistic edge of the mechanical system and manage the fully accepted risk by how much of our capital I place in the trade. This is done for EVERY trade.
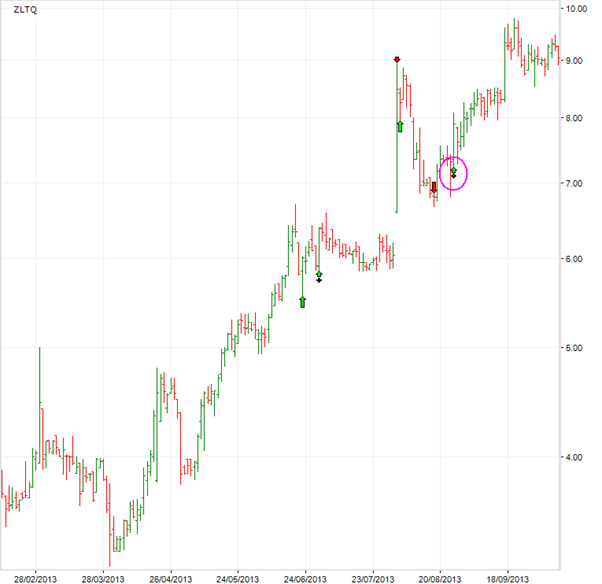
Let’s follow how this trade unfolded. Based on the volatility of this stock’s price at entry, a Profit Stop of $9.70 (close price) was set when the entry signal occurred. The highest close on 20th September fell just short at $9.60 before ZLTQ went into a sideways pattern with a low close of $8.75 in the sideways movement.
Was this the end of the trend? After all, it had bottomed at $3.20 six months earlier, was roughly at the same price – around $9.00 – that it reached two months earlier and was some 180% from its trough in April. Surely time for a retracement and hence time to sell and lock in the profit?
These are the thoughts that go through a subjective traders mind, or submitting to their broker’s line “You never go broke taking a profit!”
However, the rules of the researched mechanical system had not displayed an exit signal, so the mechanical trader doesn’t get into these mindset games – they just continue to hold the position, a simple one second decision each trading day as the trade remains open, day after day.
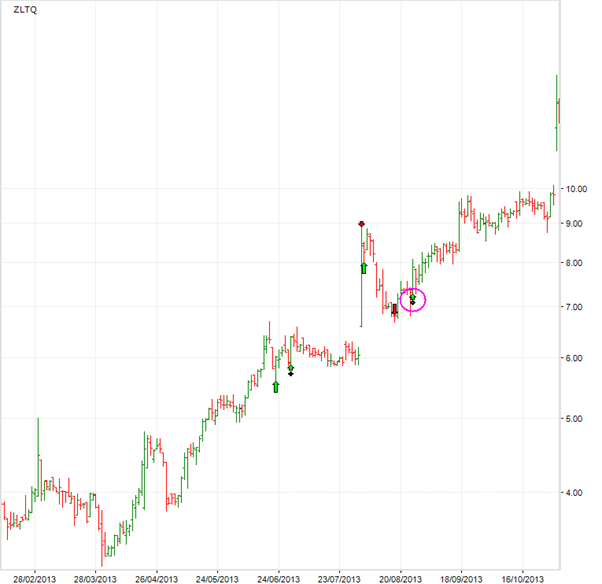
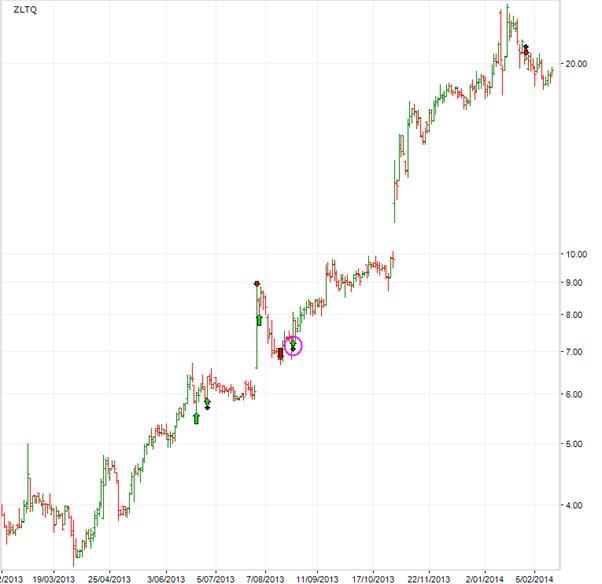
After 6 weeks of sideways movement, a period in which the subjective trader would have been torn between holding or selling while sitting on a 20%+ profit, ZLTQ had a serious jump, up 32% in a day closing at $12.97 on 31st October. The open profit was now 70%.
Surely time to sell and take the money?
But no exit signal, not even a Profit Stop! You are correct, I did say earlier that the Profit Stop was set at $9.70. What’s up here?
Behind the scenes the mechanical system has determined that ZLTQ has reached a zone whereby, for these circumstances which had occurred thousands of times in over 100,000 researched trades over more than 20 years on three different equities exchanges, it would ignore the Profit Stop and let the profits run, until a certain set of criteria were met to exit.
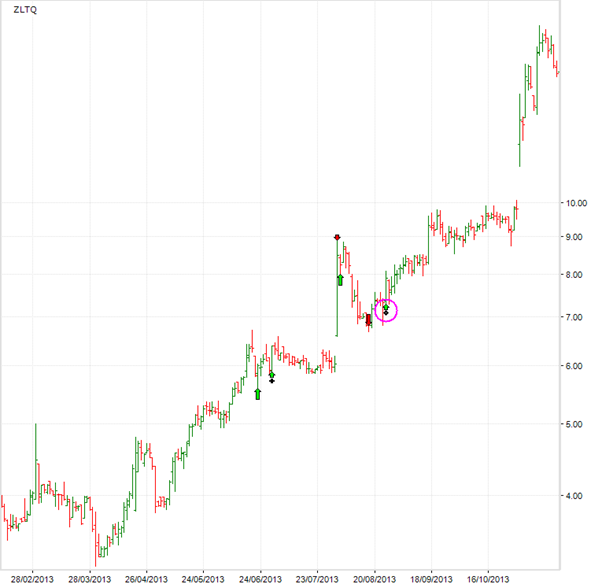
The trade remains open as it rises from $12.97 to $16.64, a 28.3% rise in eight trading days and sitting on an open trade profit of 118.7%…until a half decent 14% retracement in a week!
“That’s it, time to take profits at $14.99, a 97% profit before I give it all back!” says the subjective trader.
But still no exit signal. So the position is held, not sold, by the objective mechanical trader.
The mechanical trader whose mindset has been tuned to the ebb and flow of price action accepts the risk being taken here because she trusts her researched rules that comprise her probabilistic edge. And she knows how the edge will translate into a portfolio equity curve that over a large sample of trades will massively outperform the market because she has seen this in 1000’s of simulated equity curves and in publicly traded portfolios.
So she trusts and doesn’t second guess the rules, and holds. What next?
Over the next two months to 16th January, ZLTQ continues to rise to $24.49, now exhibiting a 221.8% open trade profit.
As an objective mechanical trader that has executed thousands of mechanical trades I know that no trade lasts forever and that this ride will come to an end where the trade will be closed, the profits returned to the portfolio and new mechanical trades opened with the proceeds.
So how did this story end?
Eventually ZLTQ’s price retreated sufficiently relative to its previous price action to provide an exit signal. The trade was closed on a Market on Close order on 31st January at $20.49 for 169.3% profit over five months.
Since the exit signal ZLTQ’s price has continued to slide. However, the objective mechanical trader knows that ZLTQ could rise again and the mechanical criteria will provide yet another entry signal, or ZLTQ’s price could fade away to much lower levels. By then I have moved onto other trades…..
Was this trade in ZLTQ the perfect trade for a medium term horizon? Let’s compare it to another trade that I did to help us decide.
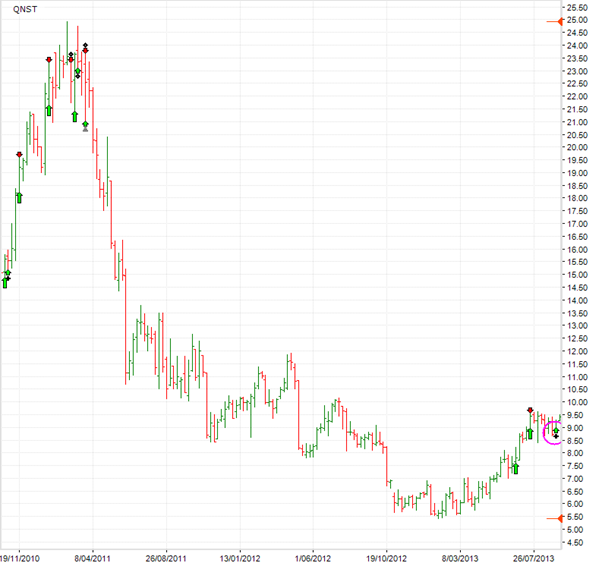
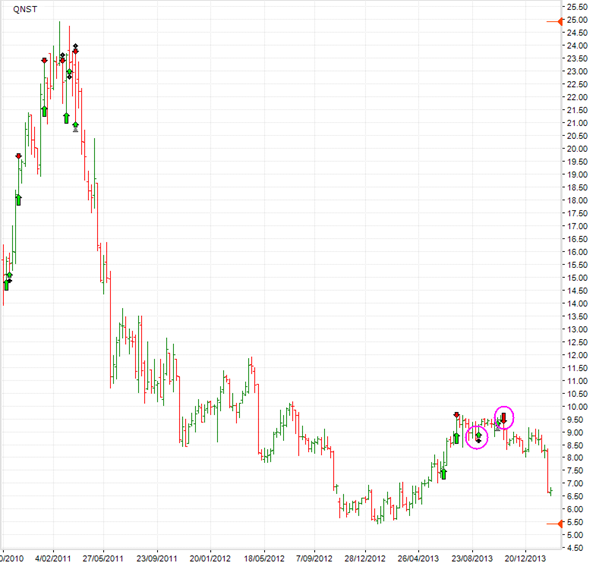
On 6th September, 2013 I entered a trade in QNST on the NASDAQ on a Market on Close order at $9.22. The weekly chart above shows the entry signal that closely followed a juicy 17% move over five weeks. It looked like another thrust was brewing in the price of this stock.
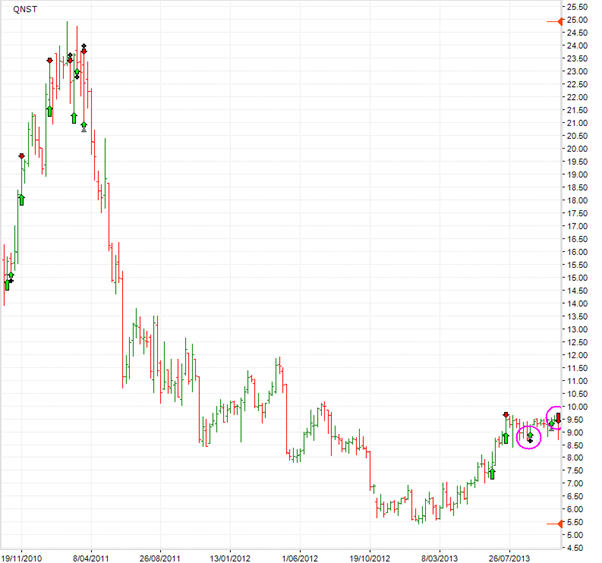
On 1st November, a mechanical exit signal occurred and I closed the position using a Market on Close order on 4th November at $9.00.
This was a 2.39% loss trade. Was this a perfect trade? You may be thinking how I can ask this, it was a loss trade!
What happened after the exit signal in QNST?
QNST has fallen by 27% since the exit signal and in the meanwhile my trading capital has been active in other opportunities.
The correct answer to the perfect trade question is that both trades were perfect trades.
Well here’s the secret to how a successful active investor thinks. The outcome of a trade in terms of profit or loss or the size of the profit or loss has absolutely nothing to do with how well the trade was executed.
Successful investors measure how well they execute their process and perfecting the following of the process is what they know they must do. But first a consistent and objective process is required. That’s another story…..
I have such a process, do you?
The rest measure how well they execute based on the outcome of each trade and along the way use a different process for nearly every trade. What makes it worse is that they have no idea what that process will produce, if they have one, because they haven’t researched it.
Which group do you belong to and which group do you wish to belong to? The successful group? Or the rest?


Are the background parameters where the 9.70 profit stop was ignored built into the SPA3 for asx program, or is it unique to SPA for nasdaq?
Response to Comment by Murray:
For both SPA3 ASX and SPA3 NASDAQ.
Regards
Gary
A good demonstration and reinforcement on why and how we need to follow our trading rules. We all (me included) need to be reminded at regular intervals on what we should do in our trading procedures.