Following on from last week’s blog, which was entitled “Cash is sometimes King”, emphasis added, we will explore deploying an equities-only long term buy and hold strategy compared to cash-and-equities for the same strategy, because oftentimes cash is not king.
The last 12 years have undoubtedly seen secular bear market conditions, which I have discussed in some detail in previous journal postings. During secular bull markets there is a high probability that one’s investment dollars will perform better by being in the market at all times rather than using a timing mechanism to pursue a cash-and-equities strategy. And in secular bear markets, to use cash at times as one’s main investment avenue.
However, the tough bit is knowing when the market is enjoying secular bull market conditions and when it is suffering secular bear market conditions. Typically investors don’t know this until 2 to 4 years into the cycle. Secular bull and bear markets have typically lasted between 13 and 21 years in the past, or close to the 18 year business cycle, on average. Therefore one needs to devise strategies that don’t suffer during the early years of a secular bear market and that don’t miss out on the early years of a secular bull market.
To demonstrate, I have spent some research time over the last few months attempting to put into perspective what the reasonable upper and lower bounds are during the secular bear market that the world has suffered since the turn of the century for an ASX buy and hold portfolio, with dividends re-invested. We can then determine whether using cash at times is beneficial or not.
In this exercise I have had the benefit of hindsight in selecting the best performers over a 12 year period but have maintained a degree of reasonableness by only selecting stocks as at 4 January 2000 that were paying dividends, were recognised as being a sound business at the time of purchase, and that were liquid enough in which to take a position. In other words, stocks that a long term buy and hold investor would be prepared to take the risk of passive long term positions that paid a dividend….. again, with the benefit of hindsight.
I know that the permutations of portfolio make-up are near limitless but if I could compile two extreme portfolios that would withstand criticism then I think that it is possible to determine reasonable potential upper and lower boundaries for returns.
I started with the lower boundary. I found the need to include 2 listed property trusts because LPT’s proliferated long term buy and hold portfolios in Australia for many years and to exclude them with those huge yields at the time would have been unreasonable.
So here is the 10 stock poorly performing portfolio which I am sure most will agree could easily have been a portfolio complied by a portfolio manager on behalf of a passive investor around the turn of the century.
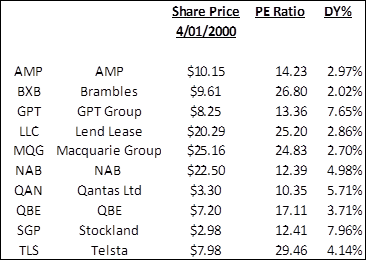
With CBA’s, Telstra’s and Woolworths dividend yields as at January 2000 at 4.44%, 4.14% and 3.45%, respectively, and the All Ordinaries PE Ratio at 22.3, I’m sure that you will agree that nearly all of these stocks could have warranted their selection, especially the two listed property trusts, GPT and SGP.
I then did the same for a performing portfolio of 10 stocks, again with the benefit of hindsight.
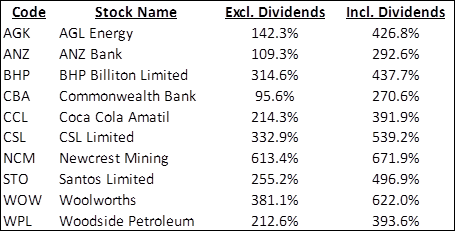
To put the growth figures into perspective over the research period, the All Ordinaries was up by 37.7% and the All Ordinaries Accumulation Index (incl. dividends) was up by 133%.
However, limiting the harry hindsight performing portfolio to just 10 stocks omitted some stocks that were minnows as at January 2000 that became stellar performers thereafter. So, in the interests of this exercise withstanding criticism and scrutiny, I decided to expand the performing portfolio to 20 and included stocks that most long term portfolios would not have had in their portfolios for most of the research period, if at all.
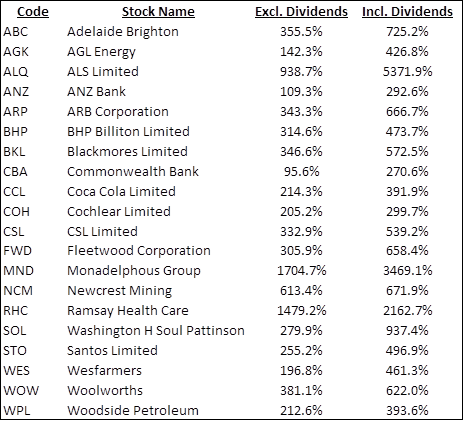
Some of these (FWD, MND, ARP, BKL, RHC, ALQ) that were minnows in January 2000 were only included from the time that they started turning over more than $100,000 per day. Their respective growths are from when they entered the portfolio.
I’m sure that a credible long-term buy and hold dividend paying portfolio chosen with the benefit hindsight would battle to beat this one. How difficult would it have been to pick these stocks in advance? And simultaneously omit all of the poor performers? In my opinion, almost impossible. That’s why I believe it can be used as a credible upper boundary for long term passive performance.
Well how did these three portfolios fare with dividends being re-invested over the entire 12 year period?
In the first instance I have simulated an even distribution of capital between all positions. In coming journal postings we will look at weighting the $100,000 starting capital between different stocks, that is, applying different money management techniques. We will also look at the effect that systematic risk management has on portfolio performance.
The first chart is scaled arithmetically and the second in semi log mode. The blue equity curve is the 20 stock portfolio, the green the 10 stock performing portfolio, the pink the 10 stock poorly performing portfolio and the red the All Ordinaries index.
The ending portfolio value, Compound Annual Growth Return and Maximum Drawdowns are listed.
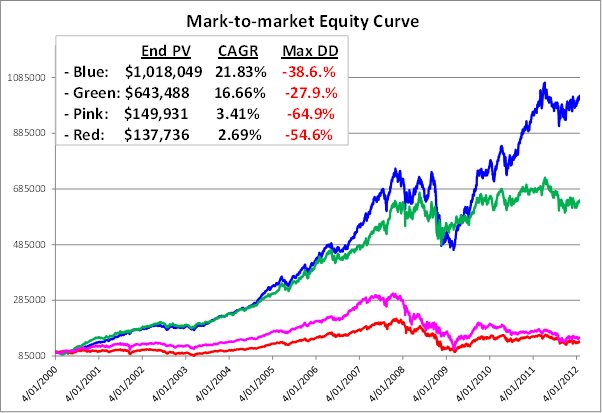
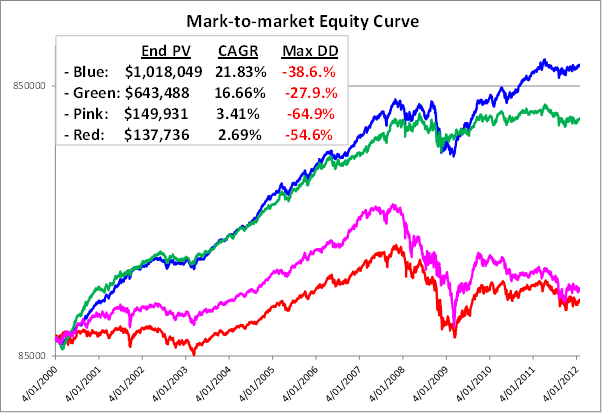
There would be millions of permutations of portfolio returns between the blue and the pink equity curves. Indeed there will even have been portfolios below the pink equity curve. Note that the pink equity curve would have underperformed the All Ordinaries Accumulation Index.
Note the maximum drawdown levels (-38.6%, -27.9% and -64.9%) that would have been endured by these fundamentally sound businesses proving that market risk has a negative effect on just about every stock, regardless of their intrinsic value. I’m sure you would agree that these drawdown levels would cause emotional pain that could lead to an irrational decision. For a percentage of people the pain could become so great that they would totally liquidate their portfolio and potentially not return to the market.
The facts are that there are thousands of variables that cause individual stock prices to rise and fall the great majority of which have nothing to do with the company itself. What’s more, the investor has absolutely no control over nearly all of these variables nor do they have the tools, knowledge, access to information or insight to know in advance how these variables will affect the stocks that they hold in their portfolios.
The main point here is that picking stocks into the long term future is an extremely difficult venture that requires enormous amounts of time and research and yet investors can still get it very wrong.
In the following weeks we will look at ways to mitigate systematic risk and to improve the worst case scenarios (around the pink line) of picking stocks for the long term with dividends re-invested.


Is this the start of new Intelledgence research? Looking forward to further posts…..
Response to Comment by Claude:
Not specifically but it will undoubtedly be used for that when we get closer to the Intelledgence research project.
Regards
Gary