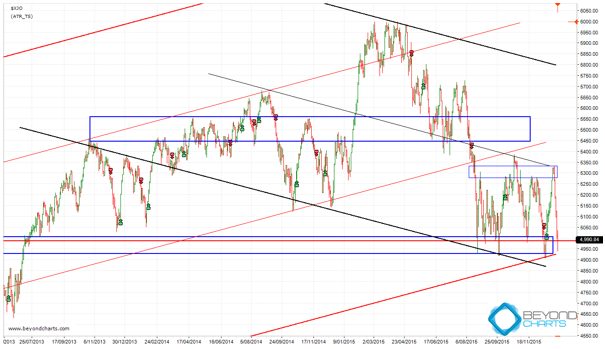
It’s a month since we last looked at the ASX benchmarks. Over the month the ASX200 has bounced from its significant support zone between 4925 and 5000 up to a forming resistance zone between 5275 and 5330, and straight back down to currently be positioned right in the middle of the significant support zone of 4925 to 5000. The support and resistance zones are shown with blue rectangles.
The decline over the last five trading sessions has been sharp, caused mainly by the Chinese introducing percentage circuit breakers to ironically reduce volatility, with the backdrop of continuing weakness in commodity prices, especially oil and hence energy stocks the world over.
The other elephant in the room, (there are a few!) is the effect of the December interest rate rise in the United States which is now behind us and should already be factored into the markets.
So here we are again a month later in the same situation, de ja vu. Will this strong support zone on the ASX hold in today’s trading session and the sessions for the rest of this week. Or will it break?
It has held numerous times since August 2015, each time that it holds adding more and more significance to what happens at this zone. What are the scenarios?
Firstly, if the ASX200 falls to around the lower down trending black trend line, which is below the significant support zone, this would be OK in my technical view. Provided it doesn’t remain below the significant support zone for much longer than a week.
Secondly, If the ASX200 falls below the support zone and remains there for greater than two weeks then technically the odds rise that the ASX200 will further, potentially to the next support zone which is at 4500 to 4625. This would obviously not be a good outcome and would set up 2016 for being a volatile and negative year.
Thirdly, support can hold and we see a rally back up to the resistance zone overhead at around 5300. Note at this level that there is also a lighter coloured black down trending line which is the median line of the down trending channel marked by the two black down trending bold trend lines. The median line coincides with this resistance zone. A break above the median line would indicate a challenge of the bold resistance zone in the middle of the chart and of upper down trending black channel line. If the ASX200 gets back to this area, further analysis at that time will be required.
Stepping back and looking at the big picture, whilst things can always get worse and prices can always go lower, the current situation is:
- The first interest rate rise the United States that was feared for many years, has happened and the sky didn’t fall on our heads. Interest rates remain an very subdued levels the world over.
- The Brent Crude Oil price has dropped to levels not seen for over 10 years and is hence not at the top of a long term upward run.
- The commodity indices peaked nearly 6 years ago and have fallen some 46% since. They too are not at the top of long term upward run.

