


Stage 1 – Become a Peaceful, Profitable, and Protected Trader

Stage 2 – Fix the Process

Stage 3 – 3 months of Skills Acquisition
Stage 4 – Deep Practice with Feedback

Stage 5 — Scale with Confidence

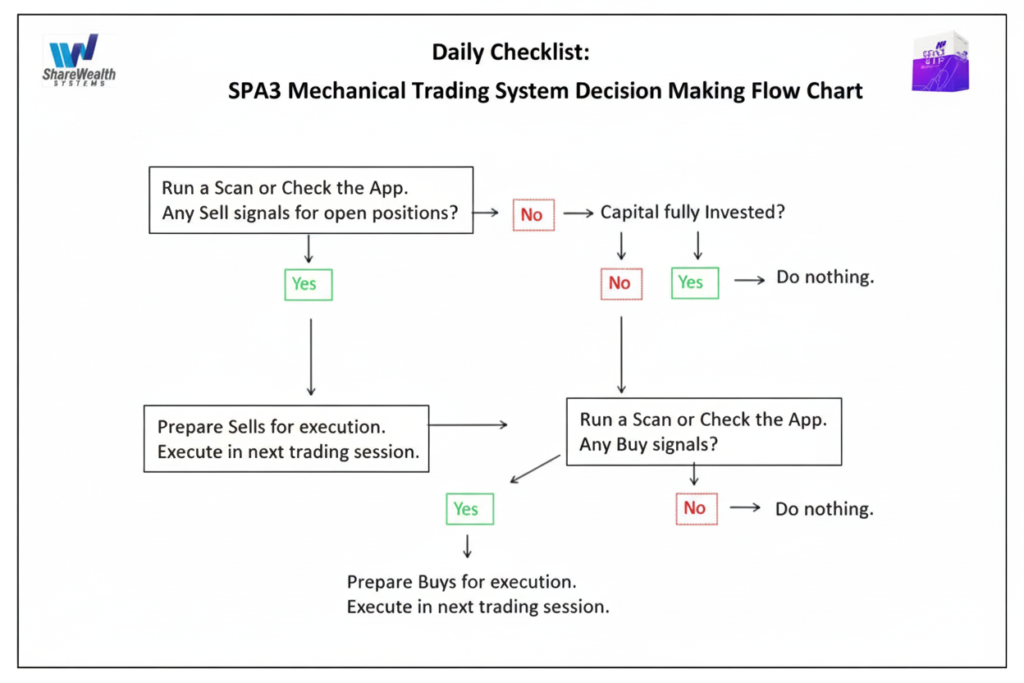
SPA3 — Apply the Rules
SPA3 Income provides the mechanical growth or income engine. It delivers objective, non-discretionary rules for entries, exits, position sizing, and capital resets purpose-built for swing trading leveraged ETFs and generating sustainable growth or income.

LTTP - Build the Trader
LTTP trains you to operate under pressure. It develops the skills of discipline, emotional control, confidence, and self-awareness required to trade properly — especially when drawdowns, losses, or missed profit trades trigger emotional responses. This is where you learn to stop reacting and start executing properly.

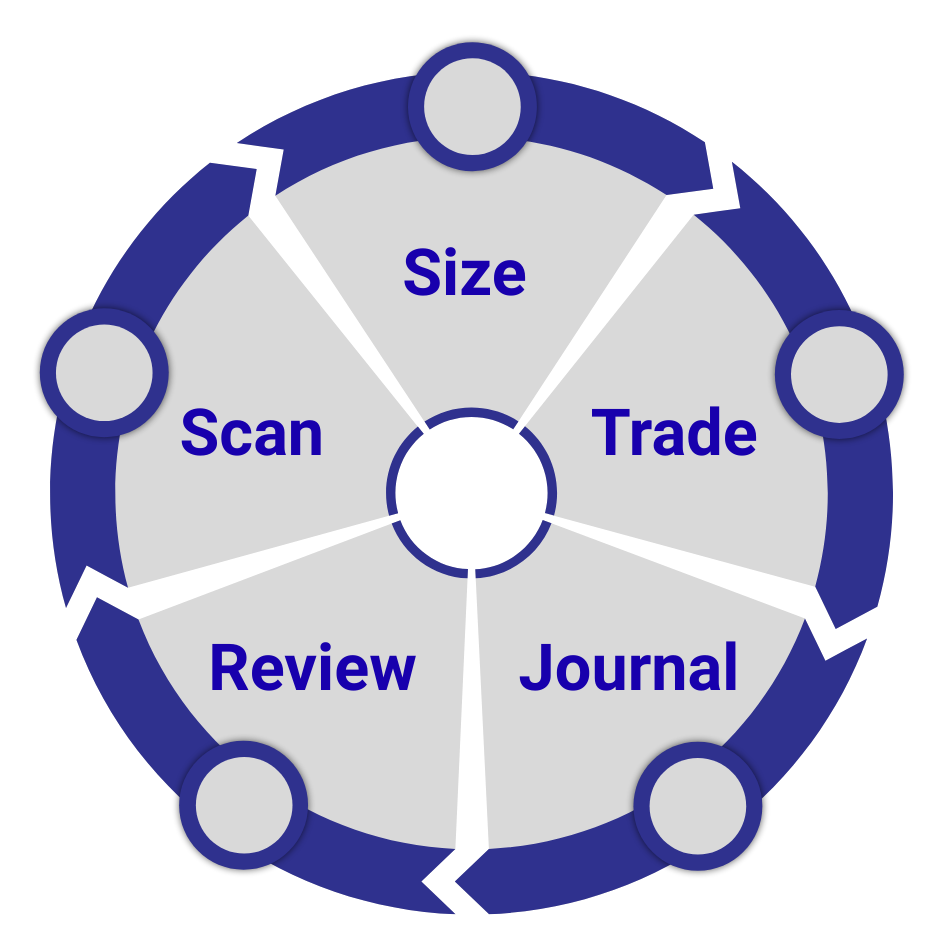
Habits — The Bridge
Habits turn knowledge and skills into automatic behaviour. Through repetition, structured checklists, and routine execution, trading actions become consistent and part of your identity, even when markets are volatile or income expectations are tested.