SPA3 Crypto
SPA3 Crypto is a long-only, trend-following crypto system designed for controlled speculation.
It brings structure, rules, and discipline to one of the most volatile markets in the world.
Just a mechanical framework built to:
Capture strong crypto trends
Exit when those trends weaken
Control downside while pursuing high growth
How SPA3 Crypto Works
SPA3 Crypto is a swing-trading, trend-following system:
- Long-only (no shorting in an upward-biased market)
- Holding periods: ~1 to 5 weeks
- Fully mechanical buy and sell signals
- Designed to fit around your life, not consume it


The Technical Engine
- ATR breakout trailing stop with crypto-specific parameters
- Each instrument is individually optimized for its volatility
- Pattern-based exits for faster protection when trends weaken
What Can You Trade? (Trading Universe)
To utilize the system, a subscription to US market data is necessary, as the universe is predominantly US-based. The Australian market currently offers only one viable instrument (CRYP).
Coins
These are foundational cryptocurrencies with their own networks. They trade 24/7.
ETFs
These are exchange-traded funds that provide exposure to crypto assets. GBTC tracks Bitcoin, ETHE tracks Ethereum, and CRYP is the sole Australian instrument in the universe.
Stocks
These are publicly traded companies. MSTR (MicroStrategy) is a "Bitcoin treasury company" that acts as a proxy for Bitcoin. COIN (Coinbase) is a major crypto exchange.
You have the flexibility to trade the entire universe or to focus only on the ETFs and stocks, which can be done through traditional brokerage accounts without needing a specialized crypto platform.
The universe will be expanded as more instruments meet the necessary criteria for liquidity and historical data.
Who SPA3 Crypto Is For
- Investors who want structured exposure to crypto
- Traders who value rules over opinions
- Those seeking high growth with defined risk
- Those seeking high growth with defined risk
- Not for all-in crypto bets
- Not for day traders
- Not for emotional decision-makers


Built for Now. Evolving for What’s Next
SPA3 Crypto launches with:
- Core ATR trend system
- Pattern-based exit logic
Future versions will introduce:
- Profit stops
- Further drawdown optimisation
The system evolves as the market evolves.
SPA3 Crypto Simulation
3 Positions | Start capital: $10,000
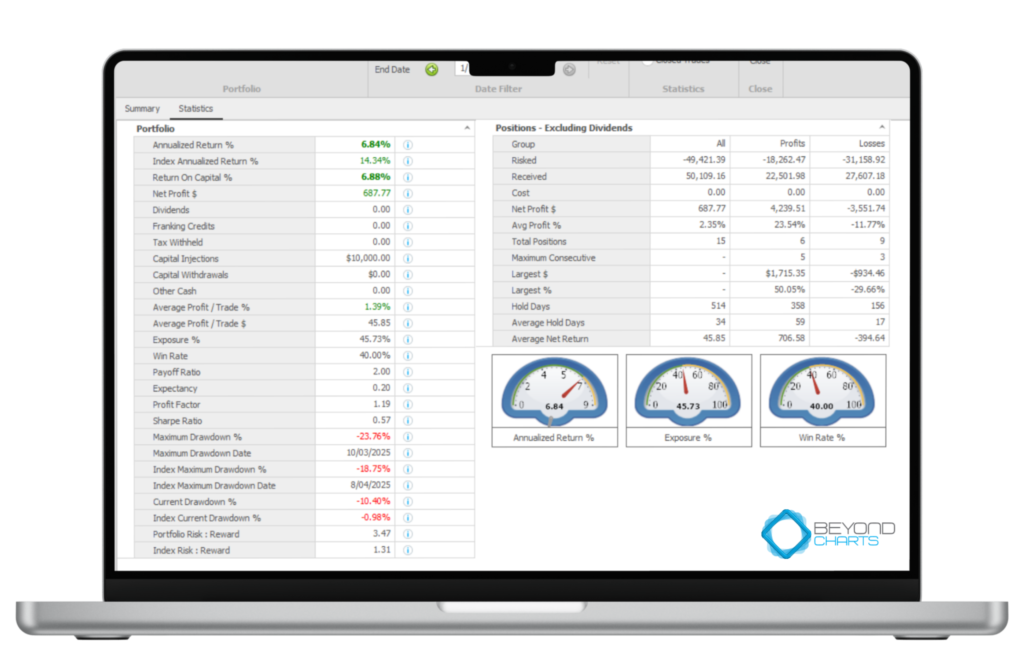
29 Nov 2024 → 1 Dec 2025
Performance vs Market
- Annualized return: 6.84% vs 14.34% (index) → lagged by ~7.5%/yr.
- Return on capital: +6.89% → Net profit: $687.77.
- Avg exposure: 45.73% (you kept ~54% in cash most of the year).
Risk/Drawdown (what actually breaks traders)
- Max drawdown: −23.76% (10-03-2025) vs index −18.75% (08-04-2025).
- Current drawdown: −10.40% (index −0.98%).
- Portfolio Risk:Reward: 3.47 vs index 1.31 (more pain per unit of return in this short window).
Edge Mechanics (closed trades)
- Total trades: 15 (6 wins / 9 losses).
- Win rate: 40.00%.
- Payoff ratio: 2.00 (avg win +23.54%, avg loss −11.77%).
- Expectancy: +0.20R/trade (positive but modest).
- Profit factor: 1.19; Sharpe: 0.39.
- Average per trade: +1.39% or +$45.85.
- Hold time: 34 days avg; winners 59 vs losers 17 → winners held ~3.5× longer.
- Largest win / loss: +$1,715.35 (+50.05%) / −$934.46 (−29.66%).
What it says (no fluff)
A choppy year with low exposure and a 40% win rate, yet the 2:1 payoff kept expectancy slightly positive. You underperformed the benchmark mainly because you weren’t fully invested when the index ran and the max DD (−23.8%) came from a string of small losses before big trends matured.
Crypto 1-yr (Nov ’24–Dec ’25):
+6.84% p.a. vs index +14.34%, 15 trades (6/9), PF 1.19, DD −23.8%. Payoff ≈2× keeps expectancy +0.20R the fix is more qualified participation and strict, mechanical execution.
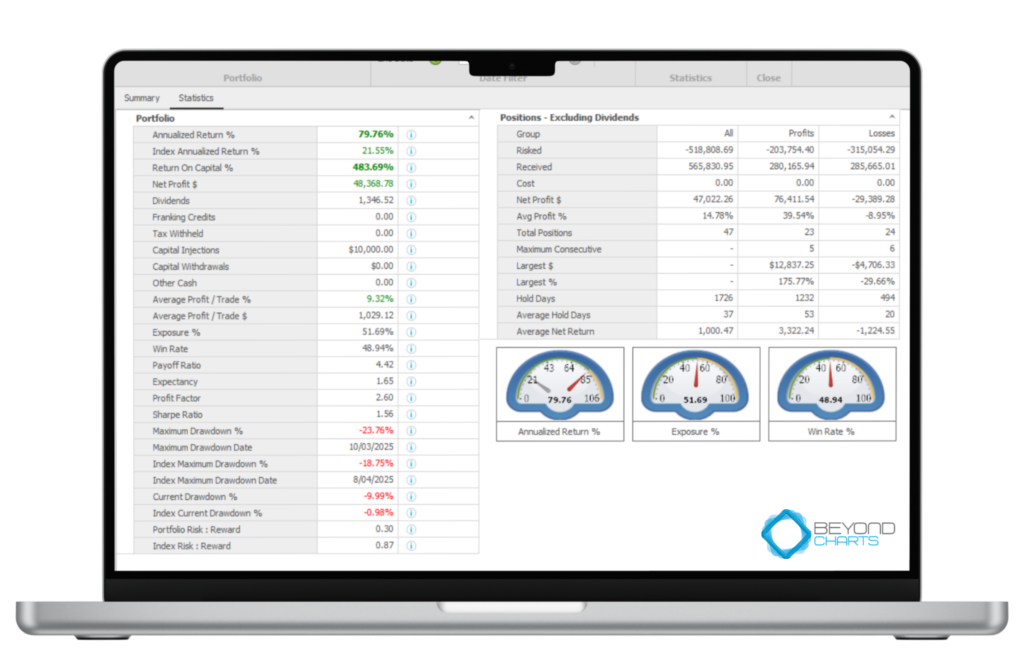
29 Nov 2022 → 1 Dec 2025
Performance vs Market
- Annualized return: 79.76% vs 21.55% (crypto index) → ~+58.2%/yr edge.
- Return on capital: +483.69% → end value ≈ $58,368.78 (net profit $48,368.78, incl. $1,346.52 dividends).
Risk/Drawdown (what actually breaks traders)
- Max drawdown: −23.76% (10-03-2025) vs index −18.75% (08-04-2025).
- Current drawdown: −9.99% (index −0.98%).
- Average exposure: 51.69% (about half the capital at work on average).
- Pain-for-gain: Portfolio risk:reward 0.30 vs index 0.87 → much better return per unit drawdown.
Edge Mechanics (closed trades)
- Total trades: 47 (23 wins / 24 losses).
- Win rate: 48.94%.
- Payoff ratio: 4.42 (avg win +39.54%, avg loss −8.95%).
- Expectancy: +1.65R/trade.
- Profit factor: 2.60; Sharpe: 1.32.
- Average per trade: +9.32%; avg net/position (ex-div): $1,000.47.
- Hold time: 37 days avg; winners 53 days vs losers ~24 days → winners held ~2.2× longer.
- Largest win / loss: +$12,837.25 (+175.77%) / −$4,706.33 (−29.66%).
- Streaks: up to 5 wins and 6 losses.
What it says (no fluff)
$10k → ~$58.4k in three years with half exposure, <−24% max DD, and a monster payoff (4.42×) delivering +1.65R expectancy.
The engine is pure SPA: you don’t need to win more than half; your winners are ~4–5× your losers and you hold them twice as long.
Keep taking every qualified signal and never negotiate exits.
Crypto 3-yr (Nov ’22–Dec ’25):
79.76% p.a. vs 21.55% index; 47 trades, PF 2.60, +1.65R expectancy, MDD −23.76%—edge intact, risk defined, compounding aggressive.
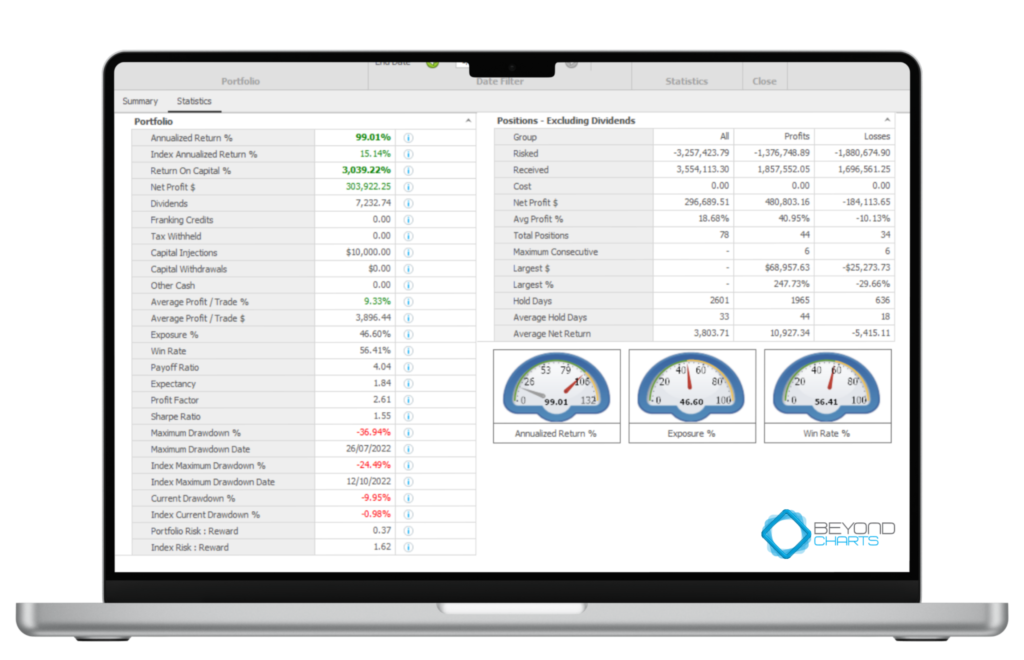
29 Nov 2020 → 1 Dec 2025
Performance vs Market
- Annualized return: 99.01% vs 15.14% (crypto index) → massive +83.9%/yr edge.
- Return on capital: +3,039.22% → end value ≈ $313,922 (Net profit $303,922 incl. $7,232 dividends).
- Avg exposure: 46.60% (about half the capital working on average).
Risk/Drawdown (what actually breaks traders)
- Max drawdown: −36.94% (26-Jul-2022) vs index −24.49% (12-Oct-2022).
- Current drawdown: −9.59% (index −0.98%).
- Pain-for-gain: Portfolio risk:reward 0.37 vs index 1.62 → far better return per unit drawdown over the period.
Edge Mechanics (why the math works)
- Total trades: 78 (44 wins / 34 losses).
- Win rate: 56.41%.
- Payoff ratio: 4.04 (avg win +40.95%, avg loss −10.13%).
- Expectancy: +1.84R per trade.
- Profit factor: 2.61; Sharpe: ~1.30.
- Average per trade: +9.33% or $3,896.
- Hold time: 33 days avg; winners 44d vs losers 18d → winners held ~2.4× longer.
- Largest win / loss: +$68,957 ( +247.73%) / −$25,274 ( −29.66%).
- Streaks: up to 6 wins and 6 losses.
Trade Distribution (whole window)
You turned $10k → ~$314k in five years with half exposure, ~−37% max DD, and a monster payoff (≈4×) driving +1.84R expectancy. You don’t need to win every time—win ~56% and let winners dwarf losers, held longer.
Keep taking every qualified signal and never negotiate exits.
Crypto 5-yr (Nov ’20–Dec ’25):
99.01% p.a. vs 15.14% index; 78 trades, PF 2.61, +1.84R expectancy, MDD −36.94%—edge intact, risk defined, compounding aggressive.
(period and market specific; past performance isn’t a guarantee of future results)
SPA3 Crypto – USA (Public Portfolio)
1 Oct 2025 → 16 Dec 2025
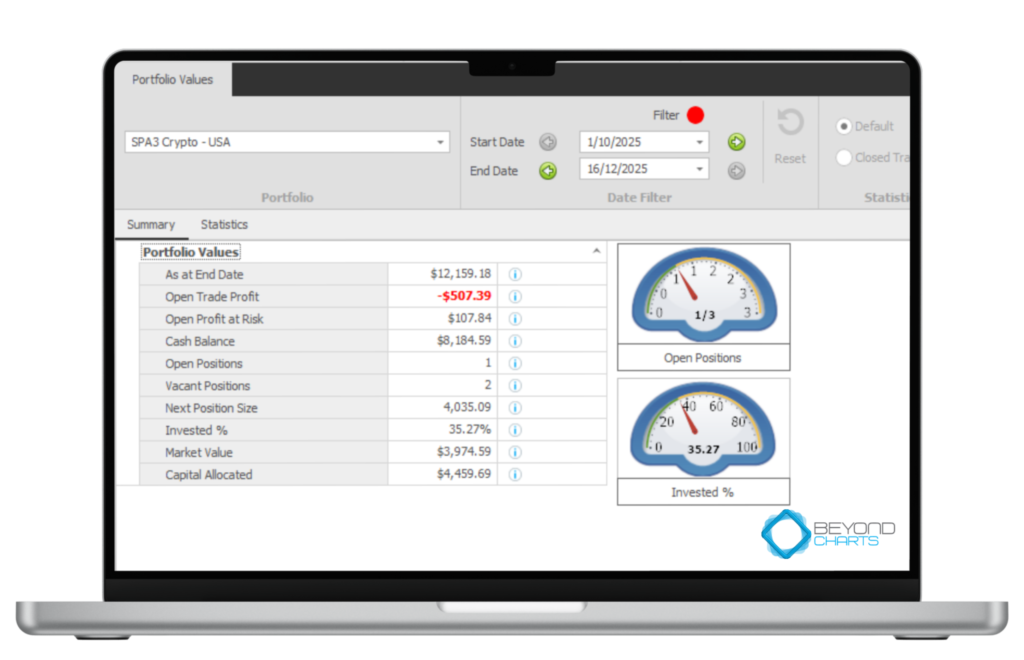
Oct 1–Dec 16, 2025:
SPA3 Crypto public account $12,159, 1/3 slots on, 35% invested, $8.18k cash, −$507 open, with only ~$108 more to risk if the stop hits—edge comes from consistent execution across many trades, not one.
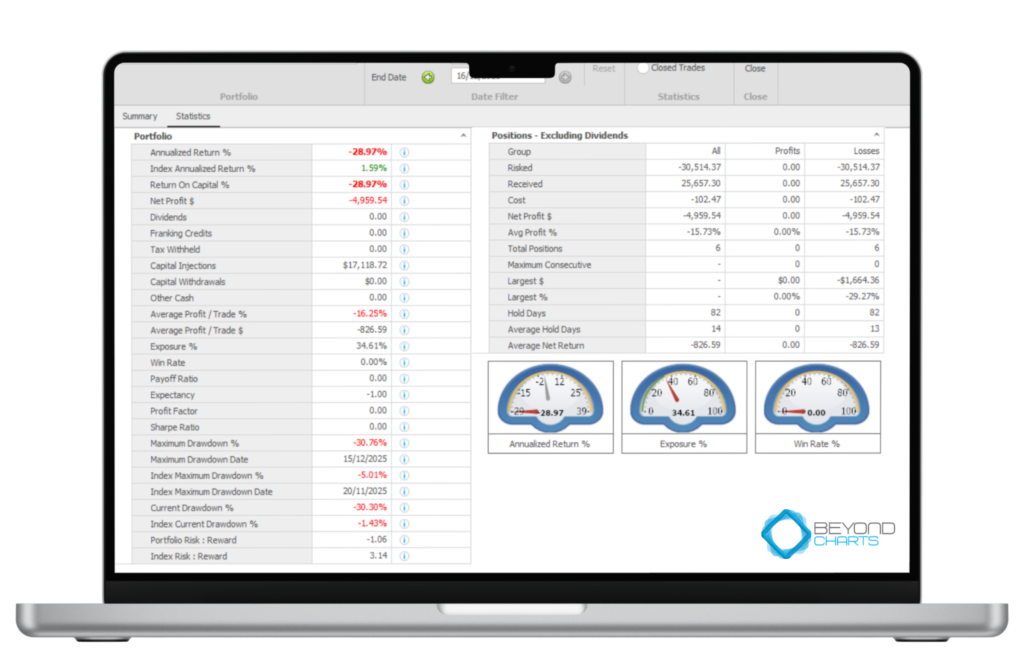
Performance vs Market
- Annualized return: −28.97% vs +1.59% (crypto index on screen).
- Net P/L: −$4,959.54 → equity ≈ $12,159.18 (matches Summary).
- Return on capital: −28.97%.
Risk/Drawdown (what actually breaks traders)
- Max drawdown: −30.76% (15-Dec-2025) vs index −5.01% (20-Nov-2025).
- Current drawdown: −30.30% (index −1.43%).
- Average exposure: 34.61% (kept a lot in cash).
- Portfolio “Risk:Reward”: −1.06 (negative because P/L is negative).
Trade stats (closed positions only)
- Total closed: 6 ( 0 wins / 6 losses ).
- Average loss per trade: −15.73% ( −$826.59 ).
- Largest loss: −$1,664.36 ( −29.27% ).
- Avg hold: 14 days (losses 13; no winners yet).
- PF / Expectancy / Win rate: 0.00 / −1.00R / 0.00%.
What this means (no sugar-coating)
- It’s a tiny, early sample (6 trades) during a choppy patch; you’re averaging ~35% exposure, so the book has been light. A 0/6 streak happens in trend systems; it looks ugly (−30% DD) but it’s math-possible at the start of any campaign. The edge only shows over dozens of trades when winners outrun losers.
It’s a tiny, early sample (6 trades) during a choppy patch; you’re averaging ~35% exposure, so the book has been light. A 0/6 streak happens in trend systems; it looks ugly (−30% DD) but it’s math-possible at the start of any campaign. The edge only shows over dozens of trades when winners outrun losers.
Feedback From Our Customers