There is an old saying in the financial markets that even a dead cat will bounce if it is dropped from high enough. This “dead cat bounce” refers to a short term recovery in a down-trending market or a sharp recovery rally following a sharp and sudden price decline. At first the ‘dead cat bounce’ can appear as a recovery or reversal of the initial move, but is then followed by a continuation of the prevailing trend.
These recovery rallies are often caused by:
• traders buying to close out short positions, (giving the impression that buyers are re-entering the market),
• other’s buying on the assumption that the price has reached a bottom and that they are buying at a discount or those buying in fear that they have missed the previous upward price movement and are desperate to be part of the action. These are generally misinformed, knee jerk reactions initiated by those without a plan or systematic approach to their investing activities. They are responding to an emotional need to “buy now because the price is cheap” or on some other misinformed and misguided whim.
During this period price action often becomes extremely volatile as traders and investors struggle to determine where the market is headed. Often large price ranges in either direction are common as one day the market appears bullish and positive only to be followed the next day by bearish price action as negativity once again pervades. It is generally a risky time to be involved in the markets as these price swings can cause chaos for the unwary market participant.
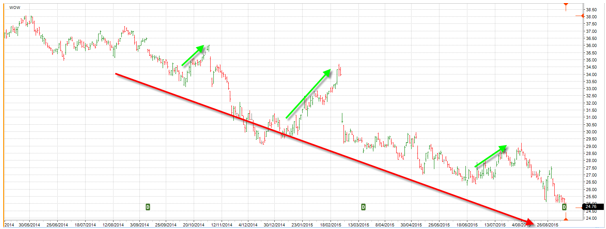
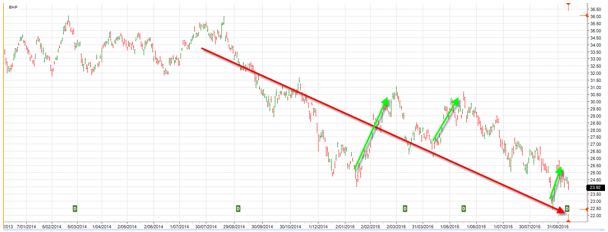
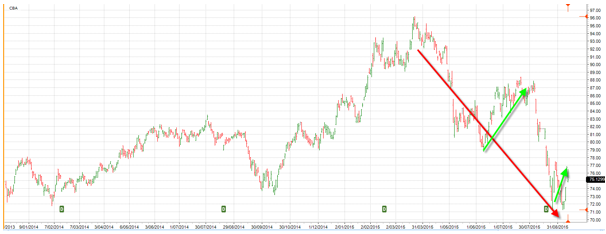
Below are a several examples of a ‘dead cat bounce’. On all these charts I have marked the prevailing downtrend with a red arrow and the ‘dead cat bounce’ with green arrows. The first three are the charts of WOW, BHP and CBA.
Woolworths Limited (WOW)
BHP Billiton Limited (BHP)
Commonwealth Bank of Australia (CBA)
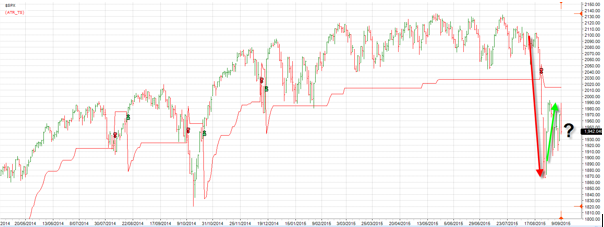
The current price charts below are of the S&P 500 Index and the All Ordinaries Index.
S&P 500 Index
All Ordinaries Index
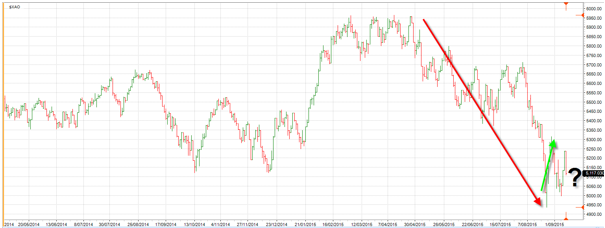
The big question of course, is where are the markets headed from here? Like the majority of ‘price patterns’ and other apparent market observations, the ‘dead cat bounce’ is always easy to identify with the benefit of hindsight! Many analysts will start to identify the current price action as a ‘dead cat bounce’ in a continuing bear market, whilst an equal amount will see it as a price bottom and the beginnings of the next bull market. As always, some will be proved right and others wrong, but only time will tell.
The great beauty of this for us is that in a high risk market (as identified by SPA3) we are simply out of the market and waiting patiently in cash until some point in the future when we will be given a signal to re-enter the market. By sticking solidly to the rules of the system we are able to avoid the mumbo jumbo, the volatility and the emotional and psychological turmoil being experienced by those who don’t have a systematic approach to their trading and investing activities.
By removing ourselves from the markets during these turbulent times we have significantly reduced our overall risk. We can ride out the potential for this to become a prolonged bear market knowing that we have protected our capital for when the time comes to re-enter the market whilst at the same time removing ourselves from a potential large drawdown if a bear market does occur. As always, risk management is of great importance!

