In last week’s posting I covered the steps for calculating the position size for a trade using the Percent Risk per Trade model. This week I will deal with the problems presented in that calculation with determining where the Stop Loss is placed for a trade.
Typically, a technical analysis technique of some sort is used to calculate where to place the Stop Loss. And herein lies the dilemma for most traders. Where do I place my Stop Loss? Let’s look at an example of entering a break out trade in BHP on 11th December 2012.
There are many criteria that can be considered when deciding where to place a technical Stop Loss for a trade which is what can make this task confusing and subjective when it is important to make it simple, objective and consistent.
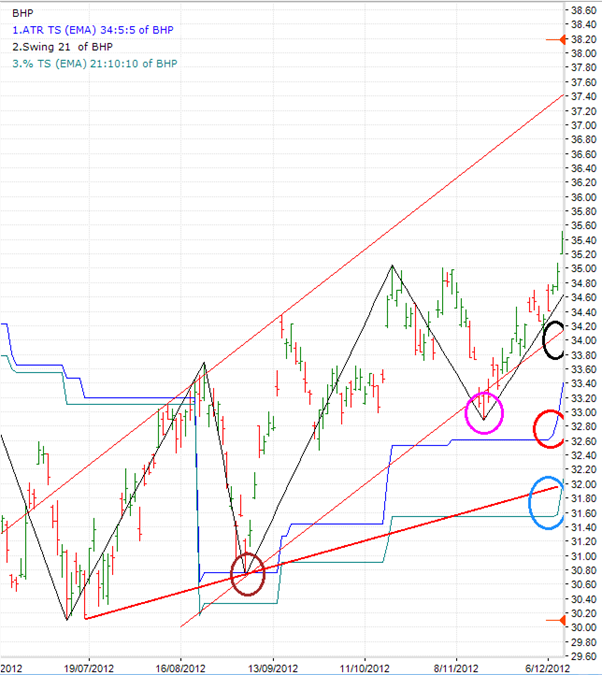
In the chart above of BHP I have overlayed the following:
- A channel demarcated by red parallel trend lines. Placing trend lines on a chart is a subjective technical analysis technique. In this example I have used a trend spine (not shown on the chart) and then created upper and lower parallel channel lines.
- A bold red support trend line that touches the lows of two troughs.
- An ATR Trailing Stop based on a 34 day EMA and ATR multiple of 5. Sure it could have been a 21 day ATR with ATR multiples of 3.5 or 4 which would have raised the Stop Loss, or any other. This is the stepped blue line on the chart. ATR involves volatility in its calculation.
- A 21 day Swing, or Zig Zag. This technique ‘swings’ through ‘noise’ and charts clear peaks and troughs. This is coloured in black.
- A teal coloured 10% Trailing Stop from a 21 day EMA.
Other valid methods for determining where to place a technical Stop Loss include:
- Parabolic SAR.
- Horizontal support and resistance lines.
- Fibonacci levels.
- Darvas boxes or rectangles.
- Various trading bands such as percentage trading bands, the ATR based Keltner Channel or based Bollinger Bands.
- Various bar chart and candlestick technical patterns.
- Ichimoku Clouds.
I could go on but I think you get the message! They would all provide a different Stop Loss, some very different, from which to calculate the trade risk. Also different timeframes and parameters can be used for each or these! Potentially subjective and inconsistent in the extreme!
So where would the best place be to place the Stop Loss for this trade?
This is where other criteria could come into the decision making process such as the term of the trade; is this a short term trade or more medium term or longer term? Short term might use the black ellipse at around $34.10, medium term the magenta or red ellipses, say at $32.88 or a few cents below, and longer term the brown at $30.72 or a few cents below. (The ‘few’ would need to be defined!!)
Does one use a ‘weight of evidence’ approach, that is use a price where a number of technical techniques merge or cluster, such as where the brown ellipse is placed on the chart at $30.72 or a few cents below?
What effect would these various Stop Loss levels have on the position size for a trade in BHP?
As per the example in last week’s posting, using a 2% risk per trade, a $50,000 portfolio value and a buy price of $35.40, the position size, excl. the $20 brokerage, would be:
- Channel lower trend line, i.e. black ellipse:
- trade risk is 35.40 – 34.10 = $1.30: 980 / 1.30 = 753 * 35.40 = $26,656.
-
- Closest trough or 21 day swing low, i.e. magenta ellipse:
- trade risk is 35.40 – 32.88 = $2.52: 980 / 2.52 = 388 * 35.40 = $13,753.
-
- ATR Trailing Stop, i.e. red ellipse:
- trade risk is 35.40 – 32.90 = $2.50: 980 / 2.50 = 392 * 35.40 = $13,876.
-
- 10% Trailing Stop Loss, i.e. light blue ellipse:
- trade risk is 35.40 – 31.56 = $3.84: 980 / 3.84 = 255 * 35.40 = $9,027.
-
- Weight of evidence Stop Loss, or 2nd trough from the 21 day swing low, i.e. brown ellipse:
- trade risk is 35.40 – 30.72 = $4.68: 980 / 4.68 = 209 * 35.40 = $7,399.
-
Wow, what a difference!
Now let’s apply a common sense rule to these position sizes. Considering that each of these position sizes are 53.3%, 27.5%, 27.8%, 18.1% and 14.8%, respectively, of portfolio value they are probably all too big!
Using a 1% rule the position sizes would have been roughly half of these. But a trader can’t chop and change the percent risk per trade to use for different positions based on whether this particular position size ‘feels’ too large or too small! But even applying a 1% risk per trade, only the largest trade risk of $4.68, or smallest position size of $3,611 (work it out for yourself) at 7.2% of portfolio value, would probably suffice. Even so this may still be too big for some.
What most do in such situations is impose a maximum limit for their individual position sizes based on a percent of portfolio value, such as a maximum of 6%, 7.5% or 10% of portfolio value per position. However, if most of a trader’s positions using the Percent Risk per Trade (or any other model such as Volatility Risk per Trade) exceed this limit and are merely truncated to the maximum limit position size, then what’s the use of deploying a Risk per Trade model and going to all the trouble to determine where the Stop Loss should be placed when the final position size just going to be truncated to a maximum limit? Also, when the position size is truncated is the trader potentially taking too little risk, or even too much, on their individual trades – how would they know?
Importantly, how does using all these calculations translate into what effect having multiple open positions in a portfolio would have on portfolio growth and drawdown? Meaning, why go to all this trouble when you don’t really know how it will affect your portfolio over time? In different market conditions too!
Next week I’ll move towards solving the obvious problems highlighted this week and get to the nitty gritty of answering Simon’s question about calculating the Trade Risk using a consistent method that doesn’t take too much or too little risk.


Gary
This is an excellent expose of the complex interdependence of phenomena. I look forward to you clearing the clouds in the next post!
Cheers
Nigel Hope