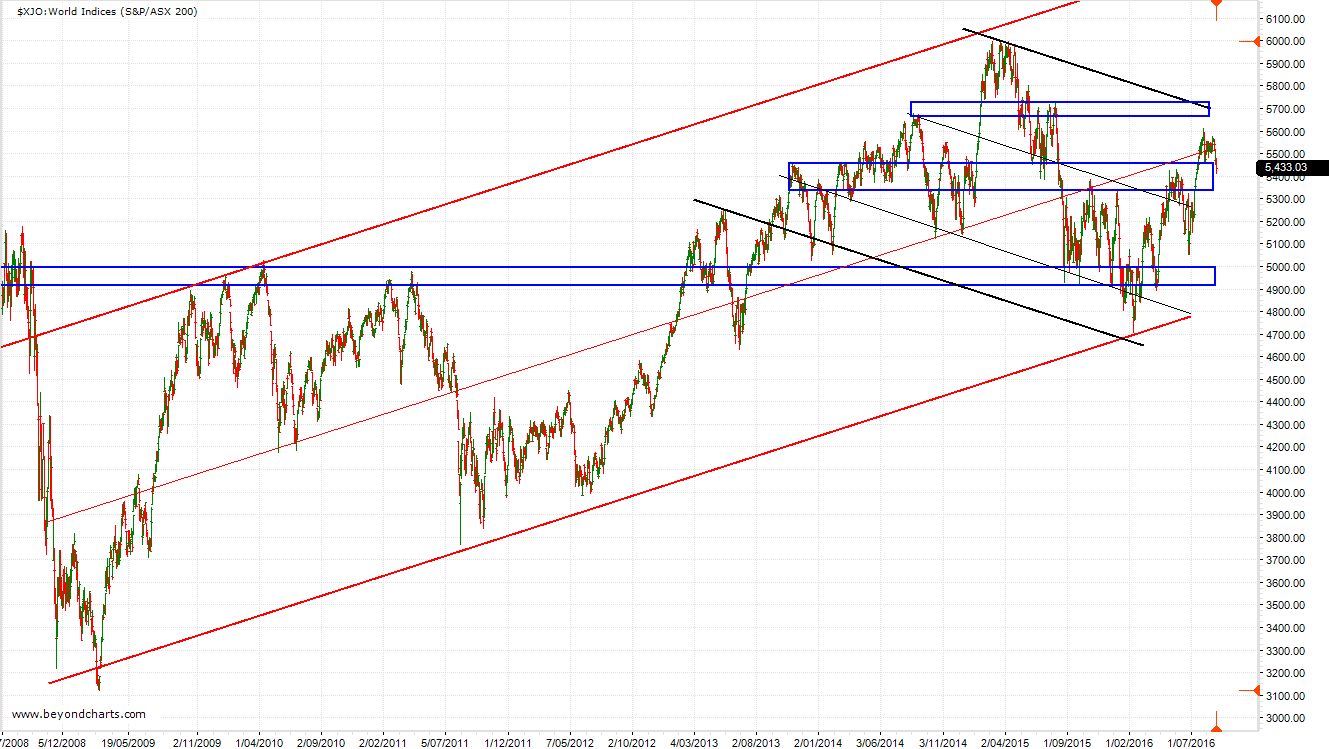
The eight-year chart below of the ASX200 shows that the Australian bourse remains in a primary bear market between the down-trending black channel lines. The switch to a primary bull market requires a break-out above the black upper channel line.
For this to occur, the ASX200 needs to remain above the support zone of 5330 and 5450 (the blue rectangle just below the current level of 5433) in the immediate future over the next week or two. A fall below this zone could see the ASX200 heading lower towards the lowest support zone shown, between 4900 and 5000. Remaining above the support zone between 5330 and 5450 increases the chances of having a go in the next month or so of breaking out of its current primary bear market and back into the control of the primary bull market channel demarcated by the bold red trend lines.
Source: Beyond Charts
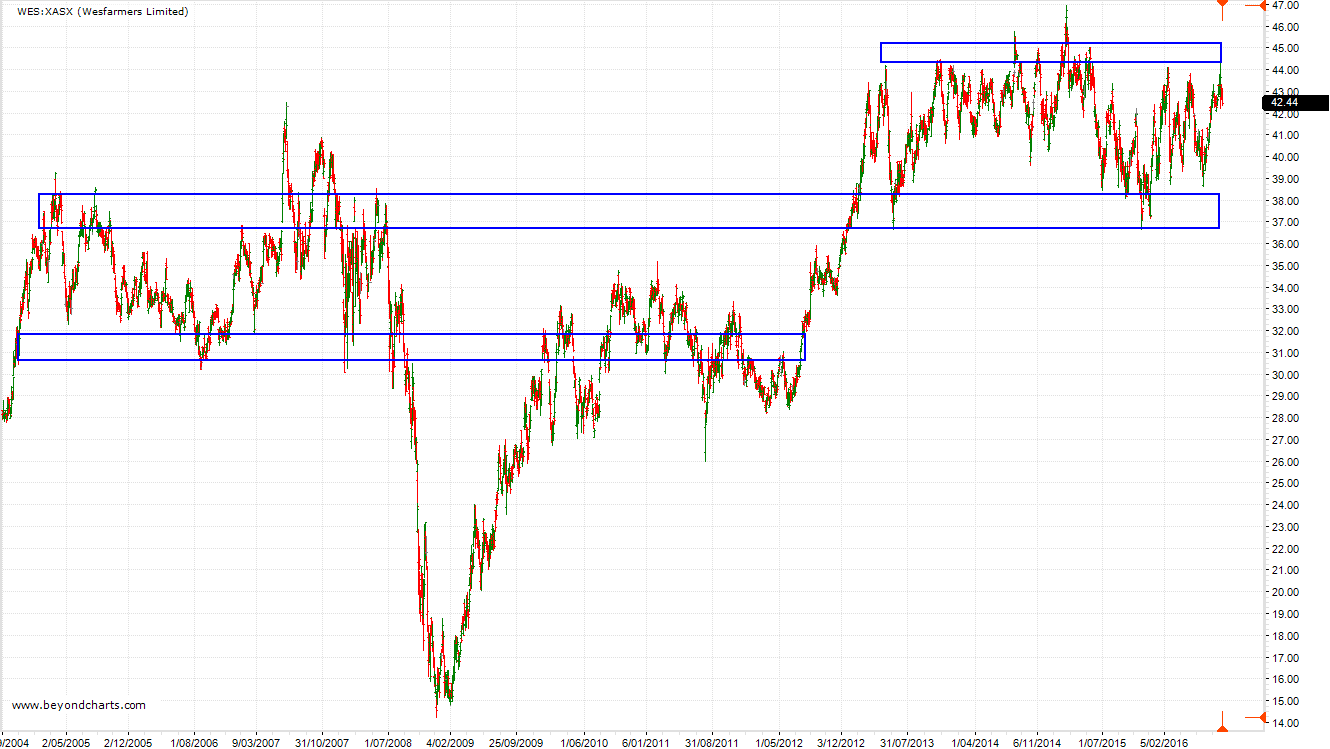
The twelve-year chart below of Wesfarmers (WES) shows that its share price has been locked in a three-year range between $37 and $45. Technically, the longer this range-trading scenario continues the higher the probability of a break-out to the upside as a long-term range-trading rectangle is typically a continuation pattern of the previous trend leading into the pattern.
There is no immediate threat of such a break-out occurring as it appears that Wesfarmers is heading back to the mid to lower levels of its $37 to $45 range again. Also, range-trading rectangle patterns such as this can continue for as long as the trend that lead into the pattern. That up-trend lasted four and half years!
Source: Beyond Charts
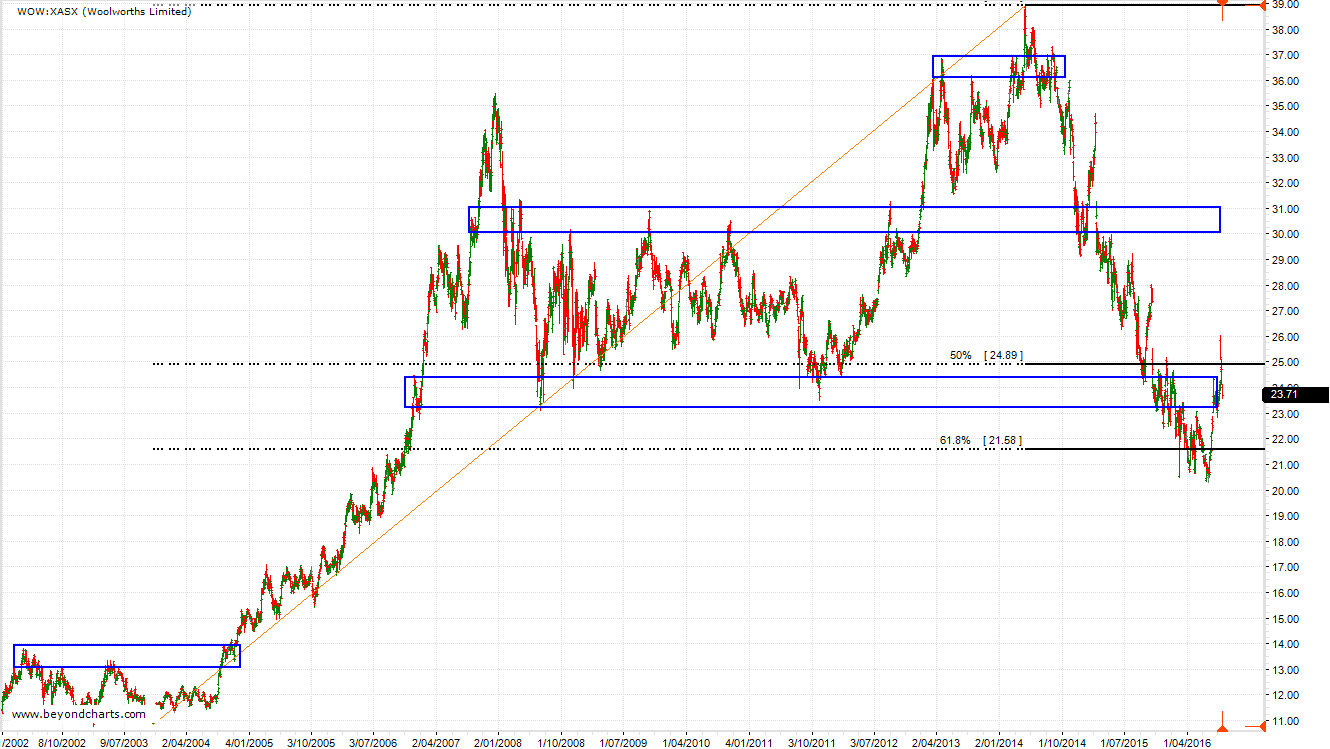
The fourteen-year chart below of Woolworths (WOW) shows that its share price is trying very hard to arrest a two-and-a-half-year down-trend. There was been a near 25% rise from early July to late August from below the key support zone of $22.80 and $24, which had become a resistance zone after WOW’s share price fell below this important zone in February 2016.
However, the rise above this zone has not persisted yet and remains in doubt until WOW’s share price can remain above $24 for seven to ten continuous trading sessions. WOW’s next main hope of not heading into further free-fall, besides remaining in or above the $22.80 and $24 zone, is it 61.8% Fibonacci retracement level which is around the $21.60 level.
All in all, it still does not augur well for WOW in the immediate future unless these criteria can be respected.
Source: Beyond Charts
Gary Stone is the Founder and Managing Director of Share Wealth Systems.


Hi Gary, thanks for your comments above on the ASX 200. If I recall correctly, they seem to be a different interpretation of the data from what I recall you said at the most recent eUGM.
My recall was that you initially thought a secular bull had resumed by breaking out from a primary bear correction (roughly April 2015 -April 2016). Or did I misunderstand? If indeed your interpretation has evolved, I’m interested in how this occurred.
Thanks,
Martin Day
Martin,
My interpretation hasn’t evolved. Still the same.
Summary:
1. April 2013: breakout by S&P500 from Secular Bear to Secular Bull.
2. March/April 2015 to April 2016: Primary Bear within the Secular Bull.
3. Aril 2016: breakout back into the control of the Secular Bull.
4. July 2016: new all-time high confirms control back with the Secular Bull.
Will remain in this status unless the S&P500 breaks back into a downtrending channel the first step of which would be falling below the previous all-time high.
Regards
Gary
Great, thanks Gary.
Oops, I think you may have been talking about the DOW/SandP with that comment in the eUGM…