With the recent run on banks, it seems analysts and commenters are in a race to prophesize the biggest market crash we’ve ever seen.
But if you put aside the noise, is the situation really that gloomy? Are we on a one way track to disaster?
Well, nothing is certain in the stock market. But the savvy investor knows you must never let noise and short-term volatility suck you in and affect your investment decisions.
Instead, you stick to a system and always look at the BIG PICTURE.
Ignore the markets secular cycles, and the chances of you and your savings falling prey to the Wall of Worry (rising government debts, new taxes around the world, rising inflation and interest rates, etc.) and its prophets skyrocket.
All these variables get accentuated by the media and commentators who love spreading bad news and causing fear, uncertainty, and doubt. Because that’s what sells and keeps people tuned in.
And, as I’ve already mentioned, these doomsayers are getting louder and louder, making them hard to ignore.
So, What Does The Price Action Tell Us? Are We Really In A Bear Market That Doesn’t Plan On Loosening Its Grip?
We must be, given the beating the market took in 2022, the bank fallouts around the globe, and the ongoing war in Ukraine.
Yet, this beating and the current state of affairs in the market are just fragments of the big picture.
Fragments that could actually confirm we’re still in a bull market.
But wait, how can we be both in a bear AND a bull market?
The answer lies in the secular trend I mentioned. You see, the analysts, news outlets, and doomsayers who claim we’re in a bear market aren’t making a mistake per se…
They are simply looking at a cyclical trend, which happens over 12 to 18 months. And when you look at this period only, we have been in a bear market. More precisely, we’ve been in a PRIMARY bear market.
But if you look at it from a broader perspective and consider SECULAR trends, which happen over 12 to 18 years…
We’re in a bull market and have been there for 10 years (since it began on the S&P500 in April 2013).
So, we’re in a Primary (short-term) Bear Market AND a Secular (long-term) Bull Market.
If you understand this difference, chances are you would’ve had the courage to ignore the Wall of Worry and re-engage the market… thereby taking advantage of the recent rally we’ve just witnessed (the S&P500 is up 14.68% since its low in October 2022).
On the other hand, those who succumbed to the noise would’ve stayed on the side-lines watching this opportunity go by… losing out on juicy profits in the process (TSLA is up 65.21% since 6 Jan 2023).
But all is not lost.
The same analysis I used to anticipate the beginning of the Secular Bull Market months before it occurred (as you can see in this blog post) …
Shows this trend could last for another 8 years, leaving you with ample opportunity to profit from it.
Here’s Why I’m Convinced The Secular Bull Market Will Rage On
For starters, take a look at the chart I used to “predict” the end of a Secular Bear and the beginning of a Secular Bull Market in February 2013:
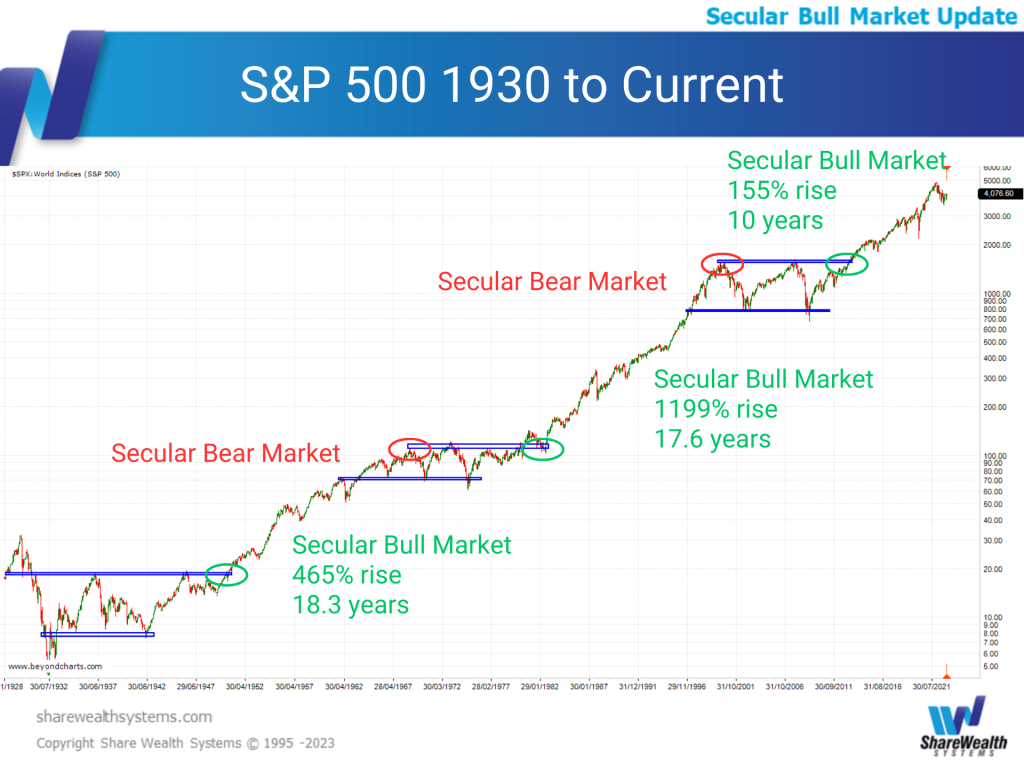
The space between the blue rectangles represents Secular Bear Markets. While the two leftmost green followed by red circles in the chart represent the start and end of the two previous Secular Bull Markets.
As you can see, both previous Secular Bull Markets lasted approximately 18 years. And we are only in year 10 of the current one. Plus, the market hasn’t grown nearly as much as in the previous occurrences.
Not proof enough, I know. Especially because some experts claim the Secular Bull Market started way back in 2009 when the market hit its lowest point during the Secular Bear.
But that’s not correct in my view. The only way to know we’re in a new Secular Bull Market is when we get a breakout above previous resistance levels.
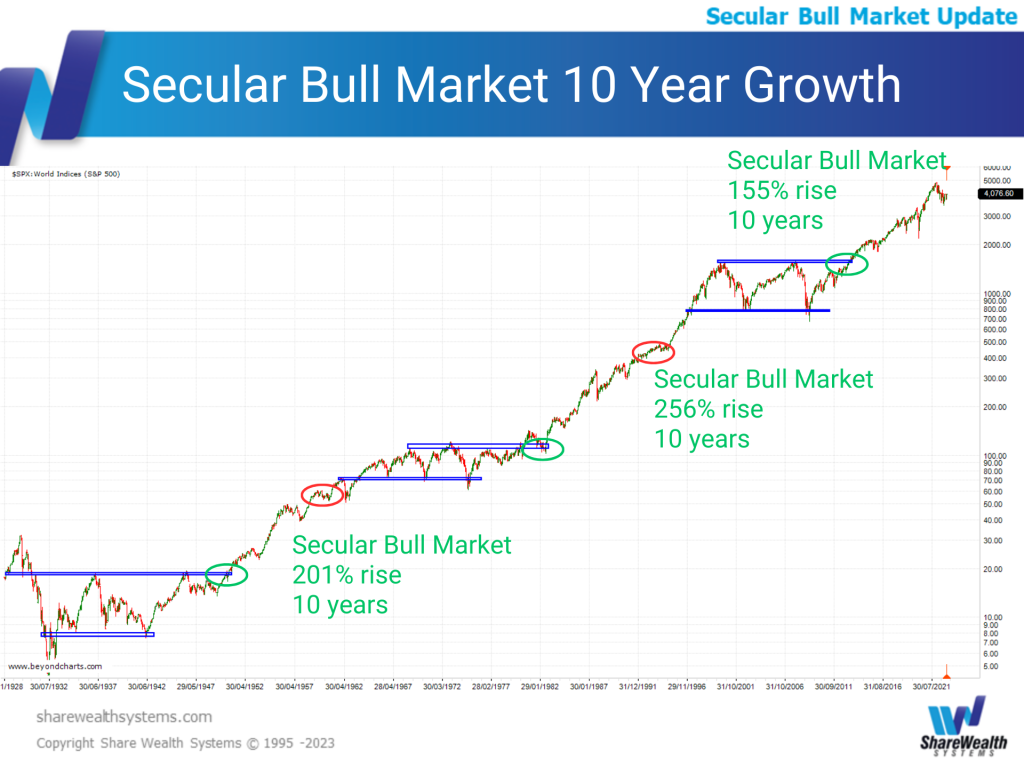
And if you look at the next chart that shows what happened over the 10-year period post the breakout in previous Secular Bull Cycles, you’ll notice both had roughly the same growth. Then, massive run ups ensued for the next ~8 years.
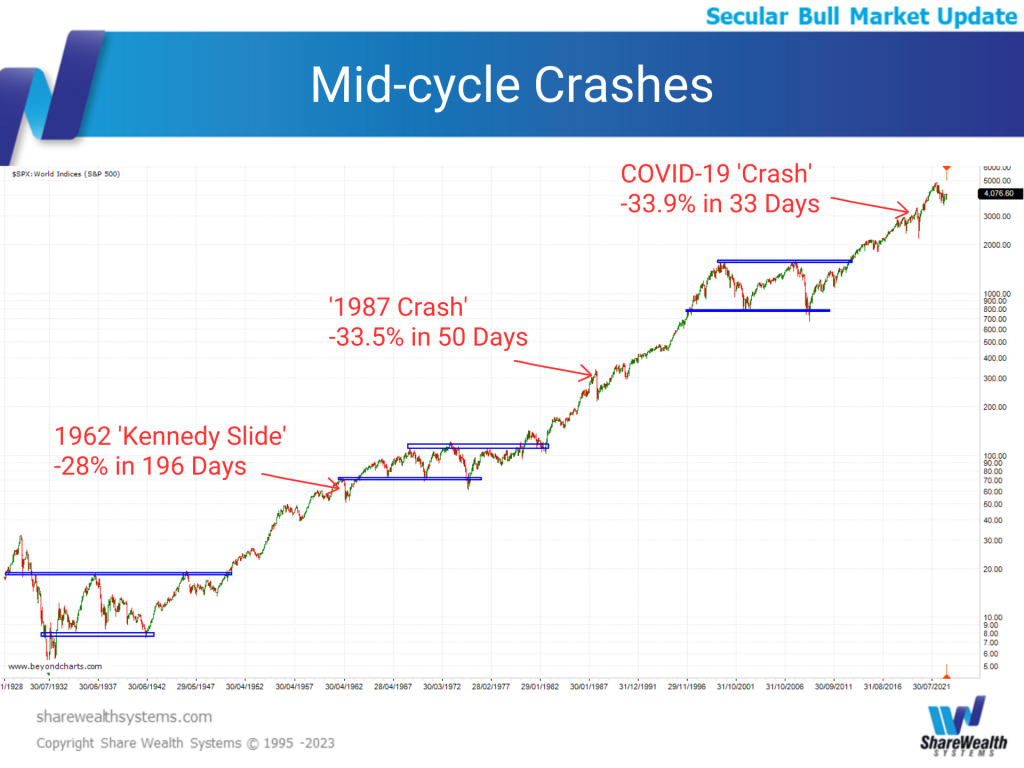
Another telling fact is that all Secular Bull Markets (including the current one) had roughly 30% falls smack bang in the middle of the cycle (see the chart below). In other words, the same rhythm has occurred in each secular period.
So where to from here…
The real challenge is predicting how long the trend will last.
Based on the current time cycles, we could have between 3.5 and 12 years left in the current Secular Bull. But there’s no guarantee this prediction will hold.
Sometimes the only way to confirm the end is happening is by spotting a failure to break previous resistance levels…
Which you can do only with the benefit of hindsight.
So, it could take 3-4 years before we can confidently confirm the Secular Bull cycle has ended.
How To Get A Heads Up Before The Secular Bull Cycle Ends
Still, there are techniques and shorter-term charts you can look at on a quarterly basis (or at least every six months) to see if they reoccur like they did in the previous two Secular Bull cycles.
And if they do, the end is near or already in progress.
One particular indicator stands out as an objective sign signaling the end of the Secular Bull Market and a transition to the Secular Bear Market:
The 14 Month RSI.
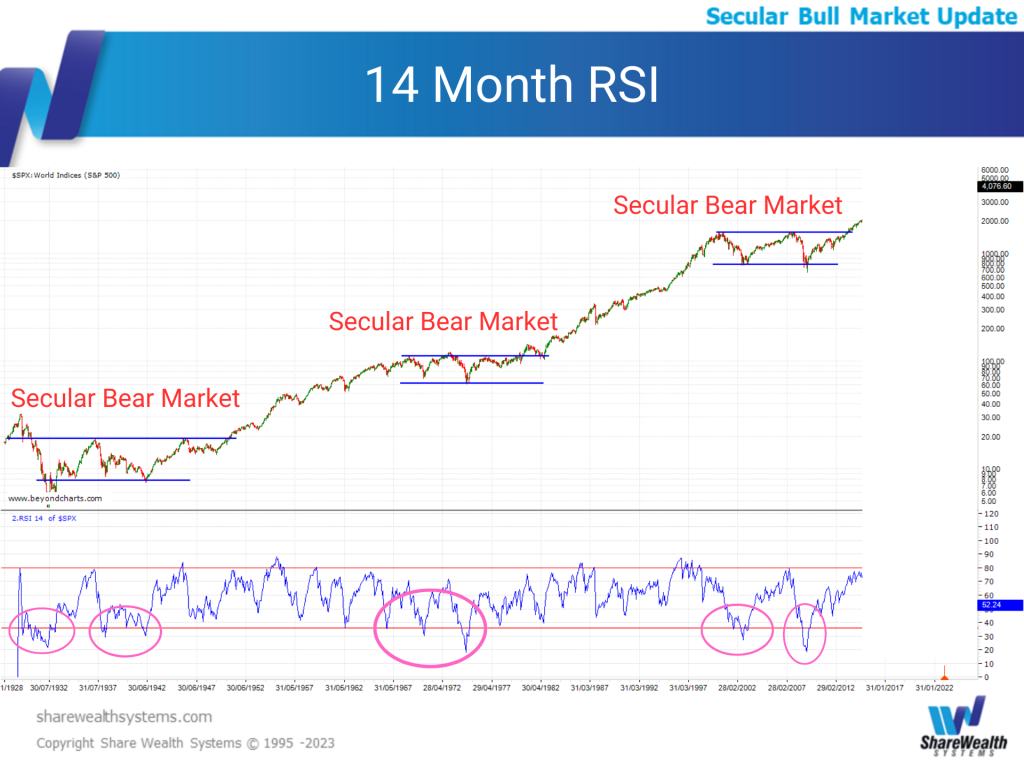
While no single indicator is a perfect “sign” on its own, the above chart clearly shows that the previous Secular Bear Market periods had drops below the 30 level on the S&P500 (red ellipses in the bottom graph)…
Indicating significant periods of market weakness.
Now, let’s take a look at where we currently stand:
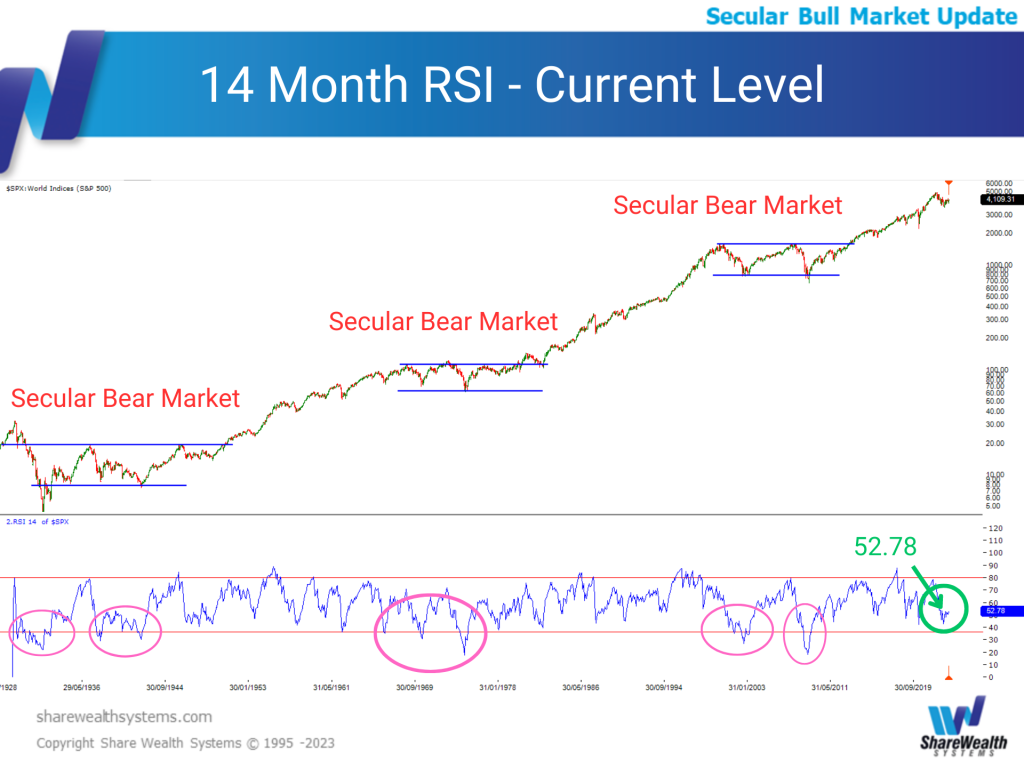
As you can see, (at the time of writing) we’re at 52.78 on the 14 Month RSI on the S&P 500, well above the 30 level. And in my technical view, this is one piece of evidence that confirms we’re still in a Secular Bull Market.
(If you want to see how all other technical and sentiment indicators paint a similar picture at the moment — watch my latest Secular Bull update video.)
A Bull Market With So Many Big Market Declines. How’s That Possible?
To get the answer, go back to the “S&P500 1930 to current” chart above.
You’ll notice each Secular Bull period had a number of declines, also known as Primary Bear Markets. Historically, as long as the market falls between 20-35% and not more — the Secular Bull continues.
This demonstrates why it’s so dangerous to only look at the shorter-term trend (and the commentary around it) when making investing decisions.
For example, if you had listened to some of the most well-known analysts and fund managers during the COVID crash (where we saw the S&P 500 fall by 33.9% in 33 days) and stayed on the sidelines until December 2020…
You would have missed out on the 114.25% return witnessed on the S&P 500 right after the crash. This translates into 83.37% in missed opportunity and capturing only 30.88% of the runup we saw from March 2020 to Jan 2022.
Imagine the devastating effect that 83% difference had on long-term portfolio performance and profitability.
How Should This Knowledge Affect Your Stock Market Behaviour?
Don’t mistake my optimism about the Secular Bull market as a call to start investing in stocks like crazy.
Do that and you could potentially lose much more than you would by staying on the side-lines.
Instead, keep the “S&P500 1930 to current” chart in the back of your mind at all times. This helps you understand the big picture of long-term market cycles and ensures the noise can never sway you.
Also remember that no matter how hard you try or how good the analysis tools you have are…
You can’t predict the future.
But as Mark Douglas says in his fundamental truth number 2:
You don’t need to know what will happen next to make money in the stock market.
All you need is a pre-made plan with defined risk and money management systems… and a DSS (Decision Support System) that helps you decide which positions to be in and when to be in them.
Have such a plan for every possible scenario the market throws at you and trust it. (Of course, you’ll need the skills and discipline to craft and execute this plan. If you aren’t confident you have those right now, check out The Systemized Investing Program.)
Always think of Denis Waitley’s words when crafting your investing process and strategy:
“Expect the best, plan for the worst, and prepare to be surprised.”
Do all this, and you’ll be able to avoid most of any Primary Bear Market (you can’t eliminate drawdowns — but you can minimize them)…
And make the most of Primary Bull Markets.
Then, even if the Secular Bull Market ends tomorrow and we enter into a Secular Bear…
You’ll have nothing to fear or worry about. Quite a liberating feeling, if you ask me.